On March 4, 2021, Understanding Houston held its first Data Dive + Workshop with United Way of Greater Houston. These are interactive and engaging sessions with nonprofit organizations in which we talk about data! This event was the first in a three-part series of Data Dives + Workshops focused on natural disasters in Greater Houston.
In the first Data Dive + Workshop, we provided an overview of the new partnership between Greater Houston Community Foundation and United Way of Greater Houston to seek feedback from local nonprofit organizations on what they want to see as we build disaster-ready philanthropic partnerships to improve our collective disaster preparedness and response. We also shared key findings from our new subtopic on the various disaster risks to the region and from our COVID-19 data page.
Here are four takeaways from the robust and productive conversations with more than 75 Houston-area nonprofit agencies.
1. One central place for nonprofit agencies to collaborate and coordinate during a disaster.
When disaster strikes, one of the greatest challenges is communicating information in a timely and effective way. Nonprofit organizations that serve on the frontlines repeatedly cited the need for a central place to collaborate, communicate, and coordinate services and resources among each other. In particular, nonprofits want a central place to:
Share and communicate real-time needs
Provide consistent, accurate, timely messaging and updates
Access and find a catalogue/inventory of resources
Share and promote resources
Conduct client intakes
Provide referrals
Track clients so referrals are productive
Access community-level demographic, household, economic, and social vulnerability data, including maps
View a database of agencies by the services they provide, their strengths, populations served, and their contact information
Complete surveys and view real-time results
2. Coordination should consider, include, and prepare for:
Start with prioritizing ALICE populations
Providing information to special populations such as individuals with disabilities
In-language and multiple language resources
Creating opportunities for agencies to focus on working in communities of color to reach under- and un-served populations
3. Invest in agencies to build capacity before disaster strikes.
Invest in disaster capacity in non-crisis times, make preparedness and collective planning a real priority.
Fund capacity building and make investments in technology and coordination which people typically do not want to fund
Establish clear channels of communication between organizations and government agencies for coordinating resources for the community
Pre-identify relevant organizations, their target populations, and their strengths
Establish a process to capture lessons learned from previous disasters and outstanding issues to address (i.e., try to reduce future severity through personal and community resilience and public/private sector responsibility)
Catalog other types of local disasters (e.g., chemical fires, explosions, etc.) in addition to the more widespread disasters
4. Gain greater clarity on COVID-19’s local impact.
As COVID-19 continues to impact our community, participants identified that they wanted to know more about its myriad impacts on different groups:
Impact on specific populations such as unsheltered community and different household sizes and compositions
Impact on family dynamics from child abuse and interpersonal violence
Impact on environment
Impact on small businesses
More on health impact
Long-term health
Non-covid health impact
Chronic health conditions
Effectiveness of vaccines
Next Steps
You can find a recording of the event here, a copy of the presentation here, and the Jamboard here.
Housing in Houston has become less affordable, and low-income households bear the greatest burden
In partnership with Rice University’s Kinder Institute for Urban Research, Greater Houston Community Foundation hosted a Housing Inequities program on October 20 to educate and engage donors and community partners on inequities in housing affordability, supply, and vulnerability in Greater Houston.
During this informative session, we explored a variety of crucial data and valuable perspectives; these are the three core insights driving the conversation on Housing in Greater Houston.
We invite you to watch the full presentation here.
Houston housing is not as affordable as we’ve been told
Houston’s “legendary” reputation for affordability has fueled the region’s record-setting population growth over the past few decades. However, Greater Houston has become more expensive in recent years, primarily because of housing costs. Home prices and rent have grown much faster than wages and income, and there is a lack of affordable and healthy housing for low- and moderate-income families.
Home values in each of Greater Houston’s three most populous counties have increased at a faster rate than in the nation overall. Between 2010 and 2017, median home values rose 33% in Fort Bend County, 31% in Montgomery County and 17% in Harris County, compared to 7% nationally.
Rent is rising for renters, too. Median rents climbed faster in both Fort Bend and Montgomery counties than in Harris County, Texas, and the nation in that same time period.
Renters and homeowners in Greater Houston have been facing increased housing costs for the last several years.
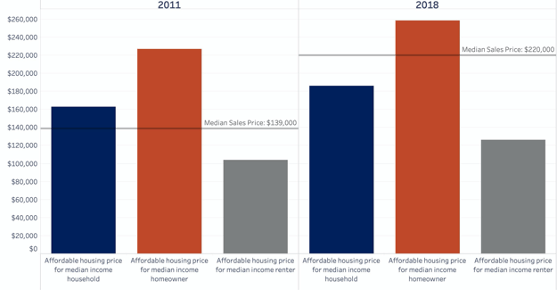
The housing affordability gap measures the difference between the price of an affordable home for a median-income household (i.e., no more than 30% of income) and the median sales price for a home in the area. The affordability gap in Harris County widened between 2011 and 2018, according to the 2020 State of Housing in Harris County and Houston from the Kinder Institute.
Source: U.S. Census Bureau, American Community Survey 5-Year Estimates, 2011 and 2018, and Houston Association of Realtors
In 2018, a household with median income of $60,146 could afford a $186,300 home in Harris County. But the median home price was $220,000. This $33,700 gap is the difference between what households at the middle income level can afford and what is available. Among renters, the affordability gap stretches to $93,500.
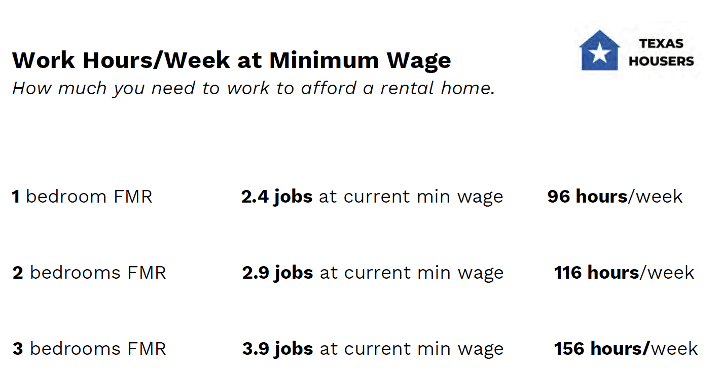
Zoe Middleton from Texas Housers illustrated how low-income households are constrained by both rising rents and stagnant wages. Citing data from the National Low Income Housing Coalition, Zoe explained that a person earning minimum wage would need to work 96 hours per week to afford a fair market rate (FMR) one-bedroom apartment in Harris County, 116 hours per week to afford a two-bedroom, and 156 hours per week for a three-bedroom.
As home prices push more families out of the market, the number of renters in the region has grown. This trend has significant implications because renters are more likely to be cost burdened than homeowners due to their lower median incomes compared to homeowners. In the three-county Houston area, 46% of renters spend at least 30% of their income on housing compared to 21% of homeowners. Renters are three times as likely to spend at least half their income on housing as homeowners.
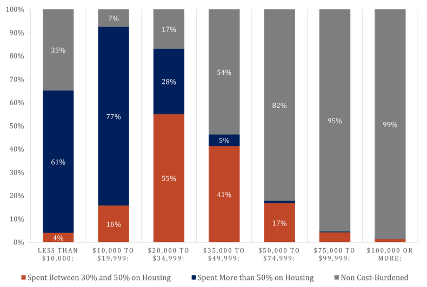
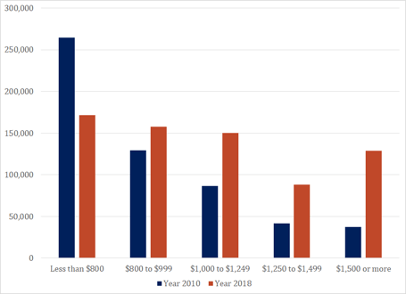
Cost-Burdened Renter Households by Income Level, Harris County, 2018
Source: U.S. Census Bureau, American Community Survey 5-Year Estimates, 2010 and 2018
The burden weighs heavier for those with low incomes. Households with incomes less than $50,000 in Harris County are significantly cost burdened. This disparity is most striking for households that earn less than $30,000. The overwhelming majority (93%) of households that earn between $10,000 and $20,000 in Harris County spend at least 30% of their income on housing compared to 18% of households with incomes between $50,000 and $75,000.
“In the three-county Houston area, renters are three times more likely than homeowners to spend at least half their income on housing.”
Lack of affordable and safe housing in Houston is costly
Houston, like many other large metros, does not have sufficient supply of affordable, safe and healthy housing — particularly for households with low incomes — but even for median-income earners. “The stock is skewed towards single family or very large multifamily,” Kyle Shelton from the Kinder Institute explains. “Houston struggles to provide the missing middle — smaller multifamily units that are typically more affordable.”
New housing construction trends indicate a growing supply of future multi-family units, but those tend to be higher-priced. Meanwhile, existing affordable units are in decline.
Renter-occupied Housing Units by Gross Rent, Harris County, 2010 and 2018
Source: U.S. Census Bureau, American Community Survey 5-Year Estimates, 2010 and 2018
In 2010 in Harris County, there was more availability among units with lower rent. However, in 2018, the supply of units with lower rent fell while units with rent above $1,500 per month surged.
“Houston struggles to provide the missing middle — smaller multifamily units that are typically more affordable.”
Greater Houston’s housing crisis “has been going on for a while, but has hit an inflection point,” Anne Gatling Hayne from the Texas Land Bank states.
We already see the consequences.
About 3,600 individuals experienced homelessness in 2019, according to the Coalition for the Homeless. While that number is half of what it was in 2011, progress has plateaued recently.
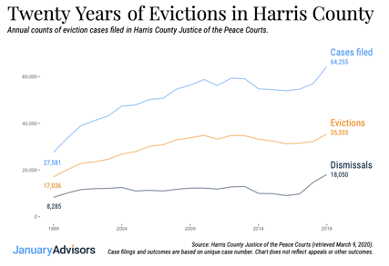
Harris County has led the nation in evictions over the past two decades, and the number of evictions in the region remains higher compared to other metros since COVID-19’s onset — another consequence of the region’s housing crisis. “[Evictions] destabilize households and the overall housing system in the region,” Shelton warns.
Homeownership is still the most significant way to build wealth — the kind that can be transferred to future generations and compounded. Barriers to homeownership not only rob families of current and future wealth, but also they weaken communities through decades of disinvestment.
The fact that the majority of predominantly Black and Brown neighborhoods in the region are located in areas characterized by older, lower-quality housing is the legacy of racial segregation in Houston. Twentieth century legal federal housing policies and banks denied mortgage and maintenance loans for homes located in predominantly Black and Brown neighborhoods. This trend of devaluing Black property continues today, Paul Charles from Neighborhood Recovery CDC clarified, which accelerates disrepair, sharing a powerful story and concluding: “So does redlining still exist?… Yes. Redlining still occurs. Redlining shows up in mortgage loans, appraisals, and insurance…which leads to devaluation of personal and community wealth.”
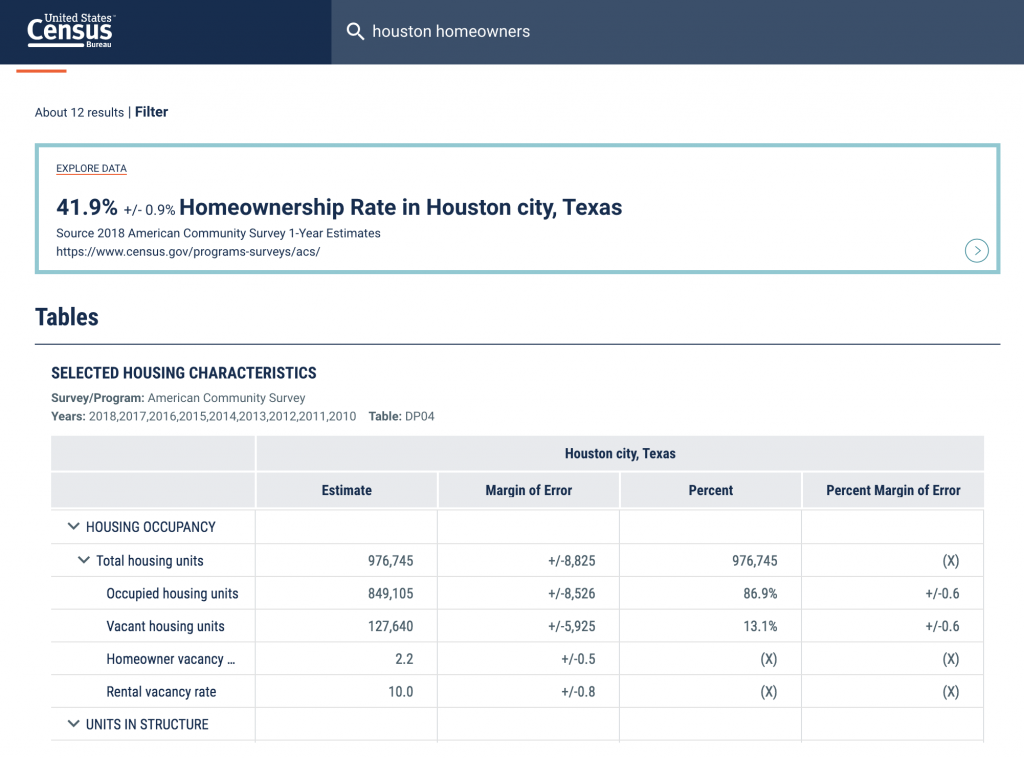
For these reasons and more, combined with slower recovery after the Great Recession and recent natural disasters, Black homeownership rates are the lowest in the region, and fell to 41% in 2017 from 46% in 2010. For comparison, the homeownership rate for White households is 71%.
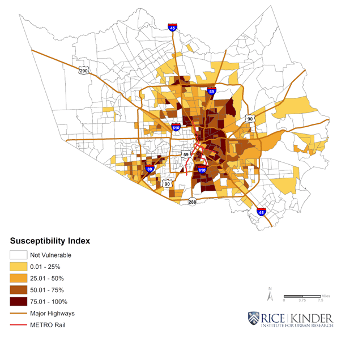
The intersection of rising home prices/rents and stagnant incomes for low-income households makes neighborhoods more vulnerable to gentrification. This can lead to the displacement of long-term residents and even threaten homeownership. Black communities in Harris County are among the most susceptible to gentrification, according to the State of Housing report.
Environmental and climate change is crucial to consider as insufficient healthy and safe housing negatively impacts resident health. Majority-Black neighborhoods report worse air and water quality, higher temperatures, and increased susceptibility to flooding.
Jonathan Brooks from LINK Houston emphasizes that transportation is the ultimate “shared interest” of housing. It literally connects us to opportunities, people, and places, which is why transportation equity and affordability is crucial to housing. A community’s transportation infrastructure, or built environment, should include high quality, safe, accessible sidewalks, bikeways, streets, transit stops, and drainage.
Because housing is taking up a larger share of incomes, many “choose” to live farther from the traditional center of the region’s economic hub, the city of Houston proper in Harris County. Given Houston’s geographic reach, this results in substantial transportation costs.
Fort Bend residents spend 60% of their income on housing and transportation alone. That’s a larger chunk than what families in Los Angeles County — notorious for its expensive housing market and lengthy commutes — spend.
How we can work together to solve Houston’s housing issues
It’s easy to get lost in the numbers. Maria Aguirre-Borrero from Avenue grounded the conversation in why housing matters. She shared a story about a 31-year old man whose greatest hope is to live in the same community in which he was raised. But, that dream seems intangible given his low income and college expenses. Reluctantly, he and his family are thinking of moving somewhere else more affordable or living together in overcrowded living conditions–another housing issue where the three-county region trends more poorly than Texas and the nation.
Housing is inherently about community. When diverse and rich communities are displaced, or when people have less money for essentials like education, food, healthcare or savings because housing and transportation costs cannibalize incomes, we will continue to see more housing vulnerability. The good news is, many smart and dedicated people and organizations are working to reverse negative trends.
Here are some of the steps we can all take to help improve access to housing in Greater Houston:
Fund what others can’t or don’t. That includes advocacy for sound and equitable housing policies at the local, city, and county level; grassroots organizations; and innovative pilot programs and projects. Philanthropy can take risks — the results of which potentially allow the government to step in to scale. These dollars fund systems change.
Use your voice to advocate for and fund equitable housing initiatives and policies that prioritize low-income and historically marginalized by talking with your neighbors about this issue and contacting local officials to voice your concerns.
Consider what you’re already funding. Think about housing and transportation issues related to areas or populations you already fund. Be open to funding transportation and housing line items and asking questions about the transportation options being provided to residents in the process. Invest in organizations working on this issue to build their capacity, provide general operating support, or flexible capital that can complement or enhance other funds. Here are just a few organizations we’ve worked with to know about:
Continue to learn and explore housing in Houston and how it intersects with other issues like transportation. Our panelists recommend the following (not exhaustive or in any particular order):
While progress is being made in the criminal justice system, much work remains to be done in removing racial disparities and the life-long consequences of incarceration.
In partnership with Arnold Ventures, the Greater Houston Community Foundation held a Criminal Justice Reform program on September 24 to educate and engage donors on various aspects of the criminal justice system nationally and locally. The program featured Dr. Howard Henderson, Founding Director, Center for Justice Research at Texas Southern University; Julie James, Director of Criminal Justice, Arnold Ventures; Sebastian Johnson, Advocacy Chief of Staff, Arnold Ventures; and Sybil Sybille, Pure Justice Fellow. We invite you to watch the full conversation here.
The informative conversation revealed five key insights about criminal justice and how we can improve the system for all.
1. The criminal justice system is expansive, has grown significantly in recent history, and affects everyone.
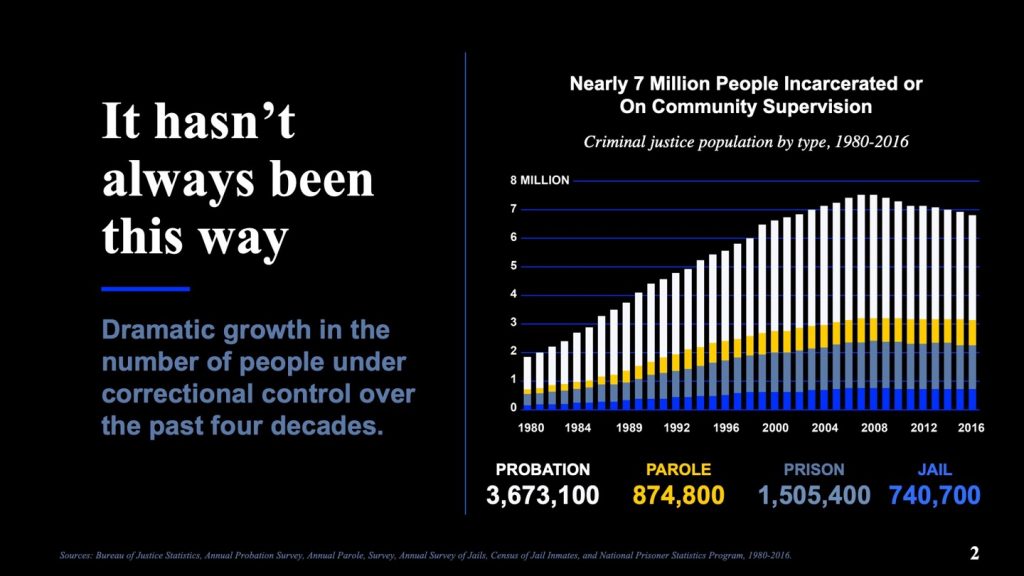
One out of 37 American adults is currently under control by the criminal justice system (i.e., imprisoned, parole, probation), or nearly seven million people, according to Bureau of Justice Statistics data analyzed by Arnold Ventures. About two-thirds of those are under community supervision (otherwise known as probation or parole) which are “hidden” drivers of mass incarceration.
“It hasn’t always been this way,” Julie James from Arnold Ventures states. The number of people incarcerated or under community supervision nearly tripled from 1980 to the peak in 2008. “This is historically and internationally unprecedented. The United States has just 4% of the world’s population, yet about 25% of the world’s prisoners are in the U.S.,” James reports. Of course, incarceration is not felt in a vacuum — entire communities and families are disrupted when someone goes to jail, such as the more than 5 million children who have had a parent incarcerated.
“This [growth in people incarcerated or on community supervision] is historically and internationally unprecedented. The United States has just 4% of the world’s population, yet about 25% of the world’s prisoners are in the U.S.,” Julie James, Arnold Ventures
Locally, Harris County has the largest number of individuals on probation in the state; and Texas has the largest number in the country, according to Dr. Howard Henderson from the Center for Justice Research at Texas Southern University. “About 70,000 return to Texas from prisons, and one in five returns to the Houston area,” he explains. Harris County Community Supervision and Corrections Department supervises nearly 70,000 individuals throughout the year, the third largest probation department in the United States.
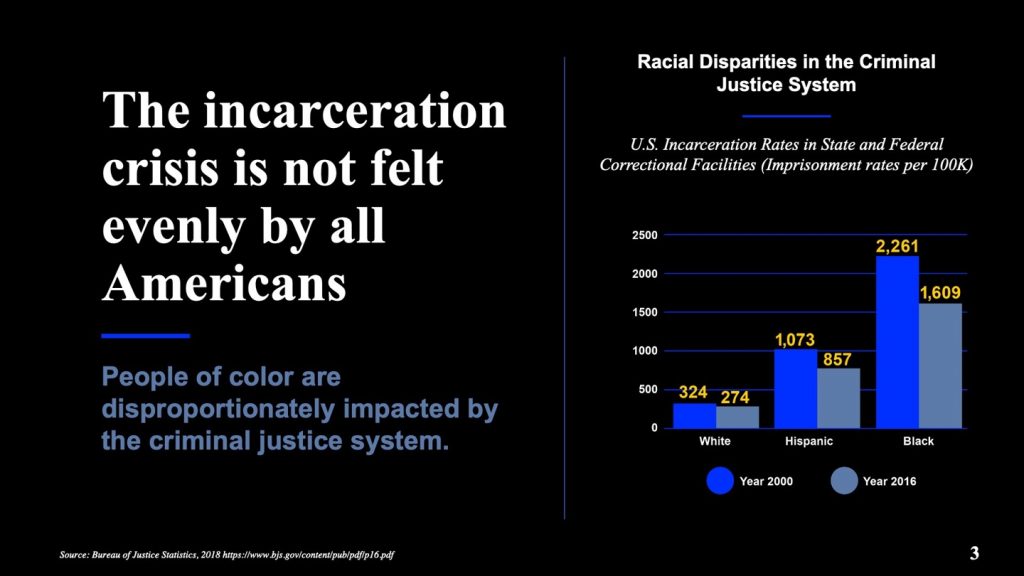
2. Black Americans, particularly males, are disproportionately impacted by the criminal justice system – and at every level.
While the criminal justice system affects everyone, some are more likely to feel these impacts than others, more frequently, and to a hasher degree. People of color, particularly Black Americans, are disproportionately impacted at each stage in the criminal justice system: arrest, bail, sentencing, release, and beyond.
A common myth is that Black and Brown people are arrested at higher rates because they are more likely to commit crimes. Research has established this just isn’t true, Sebastian Johnson with Arnold Ventures notes. What is happening, is that Black people are more likely to be associated with criminality, their communities are over-policed, and there is bias in the system that disadvantages Black people at every stage, including more severe punishments.
Nationally, incarceration rates have declined for Whites, Latinos, and Black Americans since 2000, however, Black adults are still incarcerated at nearly six times the rate Whites are incarcerated.
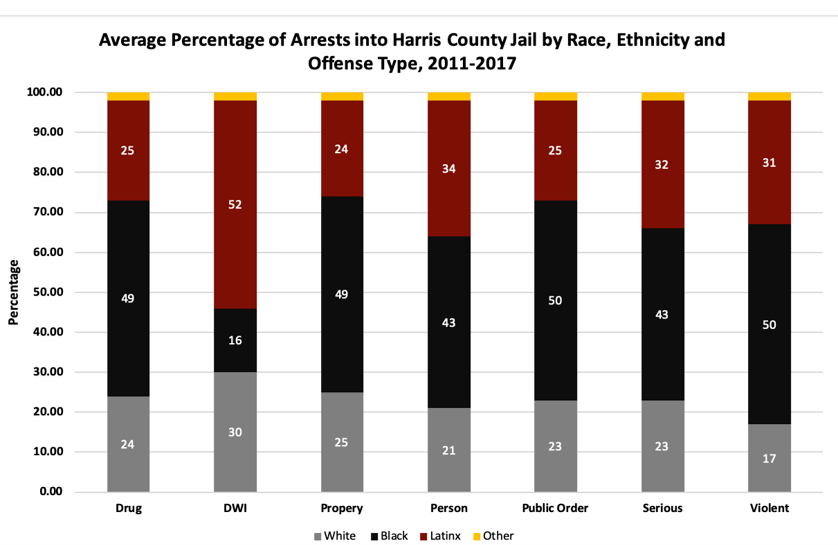
In Harris County, Blacks are overrepresented in arrests for each type of offense except Driving While Intoxicated (DWI). Despite making up 18.5% of the population, Black residents comprise between 43% and 50% of those arrested on drug, property, person, public order, serious, and violent charges, according to Dr. Henderson’s analysis.
Source: Harris County Sheriff’s Office
Consider the following:
Black people are four times as likely to be arrested in Harris County than Whites.
Blacks and Latinos are more likely to have a firearm discharged at them by a Houston Police officer than at their White counterparts.
Black residents represent 50% of all bookings into the Harris County Jail.
Half the people currently being held at Harris County Jail are Black.
Nearly 80% of the pretrial populations in Harris County Jail are Black or Latino.
Nationally, one in 13 adults is convicted of a felony compared to one out of three Black men.
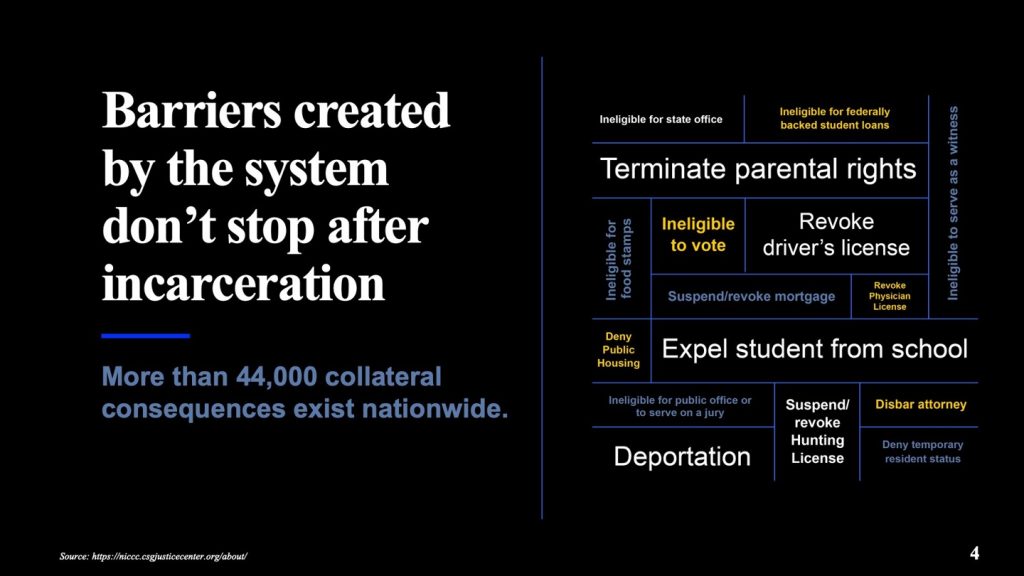
3. Those within the criminal justice system incur major personal, professional, developmental, and financial costs that don’t end after time served.
Costs for the accused, imprisoned, and released are substantial, broad-ranging, and prolonged. They include direct financial costs, opportunity costs, and “collateral consequences” which includes barriers created by the system that don’t stop after incarceration.
Even limited contact with the criminal justice system can result in fines and fees, which most people can’t afford. Three out of every four people in the Harris County Jail have not been convicted of any crime (held in pretrial). They are there because they could not afford to get out while they wait for trial. Unpaid debt in turn prevents people from getting a driver’s license, voting, getting an occupational license, and more. One study found that on average, families paid about $13,600 in court-related costs.
The costs do not stop after one has served one’s sentence and been released. The formerly incarcerated face numerous and widespread systemic barriers that exacerbate challenges to re-entry, including the denial of the right to vote even after time served, denial of housing and employment, and ineligibility for federally-backed student loans, to name a few.
Again, these impacts are borne more by Blacks than other groups. For example, Johnson cited a study which found that white people with a criminal record are still more likely to get a job than a Black person without a criminal record.
Sybil Sybille, a Veteran and community activist focused on trauma-informed approaches in the criminal justice system, was also formerly incarcerated. She describes her experience this way: “I got out of jail in 1998 and off of parole in 2002, when I could finally vote again. I could not vote for four years even while paying into the system that imprisoned me.”
In describing her attempts to get housing and employment after her release, she has paid numerous application fees for apartments only to get rejected upon learning she was formerly incarcerated. Sybille doesn’t have many other housing options due to her record and faces challenges securing employment when she is required to check the box on an application that asks if she has ever been convicted of a crime.
Sybille is currently a Pure Justice Fellow and graduated from the inaugural Smart Justice Speakers Bureau class created by Anthony Graves in collaboration with the ACLU, URRC and Texas Southern University. She is also a member of the Community Working Group of the independent monitor for the ODonnell v. Harris County Consent Decree regarding misdemeanor bail practices. She continues, “It does not matter the accomplishments I’ve made since then…it [the impact of incarceration] does not go away. I’m still being punished. I’m still living a sentence.”
“It does not matter the accomplishments I’ve made since then…it [the impact of incarceration] does not go away. I’m still being punished. I’m still living a sentence.” – Sybil Sybille
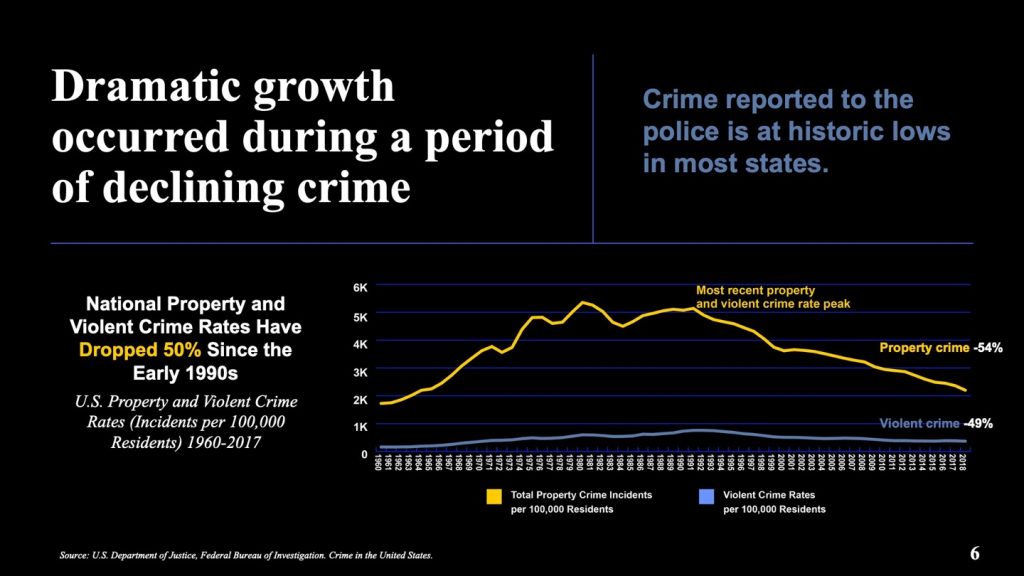
4. It doesn’t have to be this way.
There are multiple forces at work that keep this unjust system going, but the data suggest that the growth in our criminal justice system cannot be attributed to an increase in crime — national property and violent crime rates have declined by half since the peak in the early 1990s. In fact, imprisonment can advance crime “by destabilizing families and people, and restricting economic opportunity when people get out,” James explains.
According to data collected from the Bureau of Justice Statistics, the crime rate fell 21% between 2007 and 2016 in 36 states where imprisonment rates also decreased, compared to a 12% decline in crime rate in 12 states that increased imprisonment rates during the same time period.
Panelists spoke to many reasons we’ve seen explosive growth in the criminal justice system, including bias; a “tough-on-crime” narrative, policies and practices; over-policing, particularly in Black neighborhoods; and the cyclical nature of criminal justice — even serving between one and three days in jail or prison increases one’s likelihood of being arrested for another crime. The lack of resources and support the formerly incarcerated receive compounds systemic obstacles, reducing chances for success.
But, it doesn’t have to be this way. “Countries that have restructured criminal justice to focus on rehabilitation have enjoyed lower recidivism rates,” Arnold Venture’s Johnson cites. The Center for Justice Research has found that the more resources and access ex-offenders have, the less likely they are to re-offend, which prompted them to develop a dashboard of resources and support services for the formerly incarcerated.
Sybille uses her lived experiences to advocate for bail reform and trauma-informed training for judicial personnel, and has worked to change policies and laws to advocate for those under the criminal justice system. She believes that we must prioritize rehabilitation and trauma-informed care over incarceration, noting that programs that don’t address mental health challenges will never be a permanent solution. Johnson adds that so-called “diversion programs” should be evaluated so that they aren’t additional pathways into jail and are community-led.
5. We can make a difference.
Arnold Ventures estimates that if we continue at the current rate, it will take 72 years to cut the prison population in half. We can do better. “We can have much lower rates of incarceration and keep our communities safe,” Johnson from Arnold Ventures states.
There is broad bipartisan support for criminal justice reforms, Johnson continues. Here are some things you can do to educate yourself on this issue and advocate for positive change.
Funders can support policies and programs that prioritize rehabilitation over incarceration, particularly trauma-informed care. See a list of organizations below.
Be part of the conversation, particularly those who are most affected by the system. Dr. Henderson states “what we know about criminal justice is not coming from people who are most impacted by the system,” citing that 81% of faculty in doctoral criminal justice programs are White.
Employers can “ban the box” from their employment applications, signaling to those formerly incarcerated that they will be considered holistically as a candidate instead of dismissed outright for one aspect of their history.
Get involved. Attend local city council and commissioners court meetings. Sybille emphasized, “Show up. Don’t just sit on the sidelines. Be an active participant. Use your voice along with your money to make something known.”
Educate yourself. Use resources like ballotready.org and The Appeal: Political Report to learn where elected officials stand on criminal justice issues. You can find recommended reading and a list of organizations working on criminal justice reforms below.
Fellow Houstonians, we are one month into the 2020 Atlantic Hurricane Season. Experts predict another above-average hurricane season this year — meaning we could see more storms active in the Atlantic Ocean and Gulf Coast. Indeed, the beginning of the season has already been very active.
Houstonians have experienced the devastation and loss from six federally declared flooding disasters in the past five years, most notably Hurricane Harvey. Weather events do not have to be a national disaster to make an impact. Even one inch of water inside a home can cause $25,000 worth of damage. Flood events that were believed to occur every 50 years have been occurring annually in recent years. This is not an anomaly. Research shows the frequency and intensity of rainstorms have increased throughout the Houston area, and the number of extreme precipitation days is only projected to worsen in the coming years.
“Even one inch of water inside a home can cause $25,000 worth of damage.”
People in general are not great about preparing for natural disasters like flooding and hurricanes. Psychologically, our minds have a hard time grappling with massive, far-off, highly uncertain things, which can result in poor decision-making if we are caught without a plan. Also, we tend to have short memories about how we felt in the throes of disaster – diminished memories reduce the sense of urgency we feel to prepare. For example, an August 2018 (one year after the historic Hurricane Harvey) online poll found that 72% of residents in Texas had not taken any precautions in advance of hurricane season and nearly two-thirds did not have an emergency bag prepared. And, given how eventful the first half of this year has been, it’s not surprising that preparing for hurricane season is not top-of-mind for most of us. But, it must be. Here’s why.
How COVID-19 complicates natural disaster preparation
Imagine there is an invisible shield protecting our community from the negative effects of flooding and natural disasters. This shield is composed of layers that include a prepared, healthy, financially and economically secure populace; a well-resourced and unconstrained nonprofit sector; plentiful capacity in our hospitals and emergency management sectors; and, of course, strong feelings of trust within and connection to our community at large. All these factors contribute to a community’s resilience and recovery from a disaster, strengthening the shield.
But this shield can only be as strong as its weakest layer, and right now, all layers are stretching their limits. We are experiencing record unemployment. More than 800,000 families in the Houston-area were economically insecure before the pandemic, and many are struggling financially as a result of impacts from COVID-19. Nonprofits are working at maximum capacity serving those affected by COVID-19. Our hospitals are beginning to reach capacity. And we are currently fighting the worst pandemic in a century, meaning resources are strained across the board — both public and private. Complicating rescue and recovery efforts, “neighbors helping neighbors” has added risk during a time when we need to practice social distancing. Even more worrisome, social distancing will be challenging in venues like NRG or the George R. Brown Convention Center which typically serve as temporary shelters during and immediately after major storms.
“The protective shield is made stronger each time one of us takes action to improve our chances of bouncing back from a serious storm.”
That’s why it is all the more important to actually prepare this year, Houston. The protective shield is made stronger each time one of us takes action to improve our chances of bouncing back from a serious storm. This includes doing things like preparing a disaster kit, formalizing a communication plan with our loved ones, and protecting ourselves and our homes. It is imperative we do these things since there is so much that we cannot control.
Take these steps now to prepare
Get information. Visit your county’s Office of Homeland Security and Emergency Management website for excellent resources on preparing for a natural disaster, particularly during a pandemic. These sites have checklists and suggested plans for preparing disaster kits, caring for your pets, communicating with loved ones, reviewing flood zone maps, and purchasing flood insurance.
Complete a family communication plan. Plan how you will assemble your family and loved ones, and anticipate where you will go for different situations. Get together with your family and agree on the ways to contact one another in an emergency, identify meeting locations, and make a Family Emergency Communication Plan.
Assess flooding risk. Know if your home is at risk of flooding. You can view a Flood Insurance Rate Map (FIRM or floodplain map) at the Federal Emergency Management Agency’s Map Service Center or at your county emergency site.
Consider purchasing flood insurance. Harris County Flood Control District recommends that all Harris County residents become informed about their flood risk and have flood insurance no matter where they reside in Harris County. Flood insurance accelerates the rebuilding and replacement of personal property and fosters community resiliency as a whole. For information on flood insurance, visit the National Flood Insurance Program website or call 1-888-379-9531.
Sign up for emergency alerts. The Flood Warning System (FWS) offers an alert feature that allows residents to subscribe to and receive email/text alerts that report near real-time rainfall and water levels. Residents are able to customize alerts and notifications for bayous and tributaries in their particular areas of interest. Sign up for the Alert Notification System at fwsalerts.org.
Don’t get complacent – educate yourself. Check out these other great resources.
Time will tell if 2020’s COVID-complicated hurricane season will bring a storm as historic or destructive as Hurricane Harvey, but the steps we take to strengthen our shield today can also help to fortify our region for future natural disasters. After all, a lasting solution to COVID-19 may be around the corner, but flooding and hurricanes in Greater Houston are here to stay.
If you haven’t already, get ready. Hurricane season is a six-month marathon from June 1 through November 30. Let’s do our best to fortify that protective shield for our entire community. Let’s prepare, Houston.
Back in October when the world was blissfully ignorant of something called “COVID-19,” Understanding Houston featured a blog on the importance of the 2020 Census from Frances Valdez, Executive Director of Houston in Action. In her blog, Ms. Valdez highlights the importance of counting each individual living in the region and explains the challenges associated with this endeavor.
But since then, much has changed. Ensuring a complete population count, an elaborate process under the best of circumstances, is made even more challenging by the ongoing global pandemic. At the same time, the emergence of COVID-19 is itself a bold reminder of the importance of the census.
In no uncertain terms, when we undercount our population in the census, we leave much-needed money on the table. Learn how these missing funds could impact our region, why some groups are more difficult to count than others, and find out what you can do to be counted and support others working to ensure we all count.
The impact of the census in Houston
The U.S. Constitution mandates a count of its citizens every decade, the results of which determine the number of seats states get in the House of Representatives, inform the division of congressional and state legislative districts, and allocate hundreds of billions of federal dollars every year to states and municipalities for schools, hospitals, roads, and more.
About 300 federal programs like Head Start, Medicaid, Community Development Block Grants, and Supplemental Nutrition Assistance Program (SNAP) use census-derived figures to allocate more than $800 billion a year to states.1
$101.6 billion toward federally funded programs to Texas governments (state and local), businesses, nonprofits, hospitals, and households.
More than $346 million (nearly 25% of all census-guided education funds to Texas) to the Greater Houston region.
More than 25% of the state’s share of funds from the Workforce Innovation and Opportunity Act (WIOA) to the Gulf Coast region. WIOA is designed to help job seekers access employment, education, training and support services to find jobs, and to match employers with trained workers.
Census data also play a crucial role in emergency response and recovery efforts in times of disaster, such as Hurricane Harvey and the COVID-19 pandemic. The data helps planners prepare for possible risk scenarios and informs where the federal government should allocate resources in an emergency.
Given that billions of dollars are allocated based on statistics from the census, an undercount leaves millions of critical dollars on the table. The George Washington Institute of Public Policy found that a one percent undercount would cost Texas $292 million in one year alone — more than any other state.2 Over the course of a decade, that totals nearly $3 trillion dollars that Texas could have used for critical services like Medicaid, the Children’s Health Insurance Program (CHIP), Title IV-E Foster Care, Title IV-E Adoption Assistance, and the Child Care and Development Fund. Three trillion dollars is most certainly a low-ball estimate as funds devoted to these five programs typically make up half of the total amount states get from the federal government.
Hard-to-count Houston-area populations in the 2020 census
Correctly counting 330 million people over 3.5 million square miles is no small feat.3 The Census Bureau employs special methods to evaluate the accuracy of the final census figures which reveal some groups are harder to count than others. For example, the Bureau estimates a 4.88% undercount for American Indian and Alaskan Native populations living on reservations, a 2.03% undercount among African Americans/Blacks, and 1.54% undercount among Hispanics/Latinos.
Historically, populations hardest to count include individuals from diverse backgrounds, immigrants and refugees, children under the age of five, people experiencing homelessness, college students, the LGBTQ+ community, renters, and those living in complex households (e.g., multiple families or unrelated individuals living together).
States and communities with a larger presence of hard-to-count groups are more likely to experience a larger undercount in general, particularly when groups intersect (for example, young children of immigrant families of color).
Both Texas and Houston have a larger share of young people, immigrants and non-Whites than the nation. Most notably, Fort Bend County’s population under five years old has doubled — significantly higher than growth in any other county, the state and the nation. Nearly one out of four residents was born outside the U.S. Two-thirds of our region is non-White compared to 40% of the U.S.
The Center for Urban Research estimates that one in four Texans belongs to a hard-to-count population, and approximately 21% of the population in Houston’s three largest counties (1.2 million people) lives in hard-to-count neighborhoods (defined as areas where the self-response rate was less than 74% in 2010).
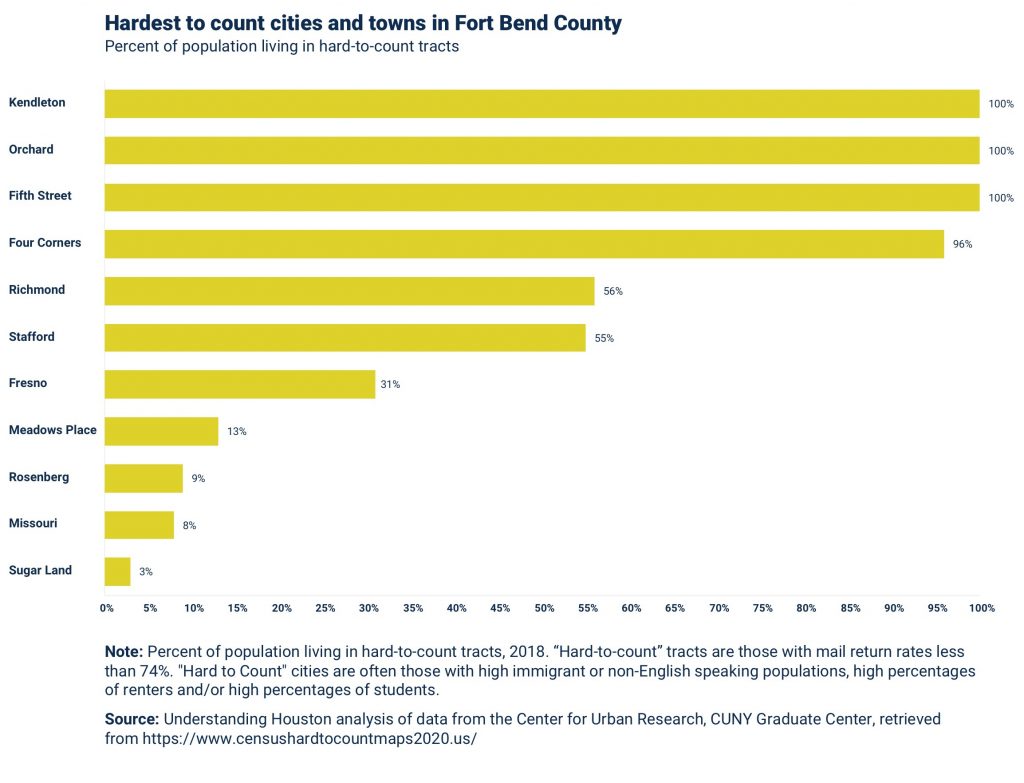
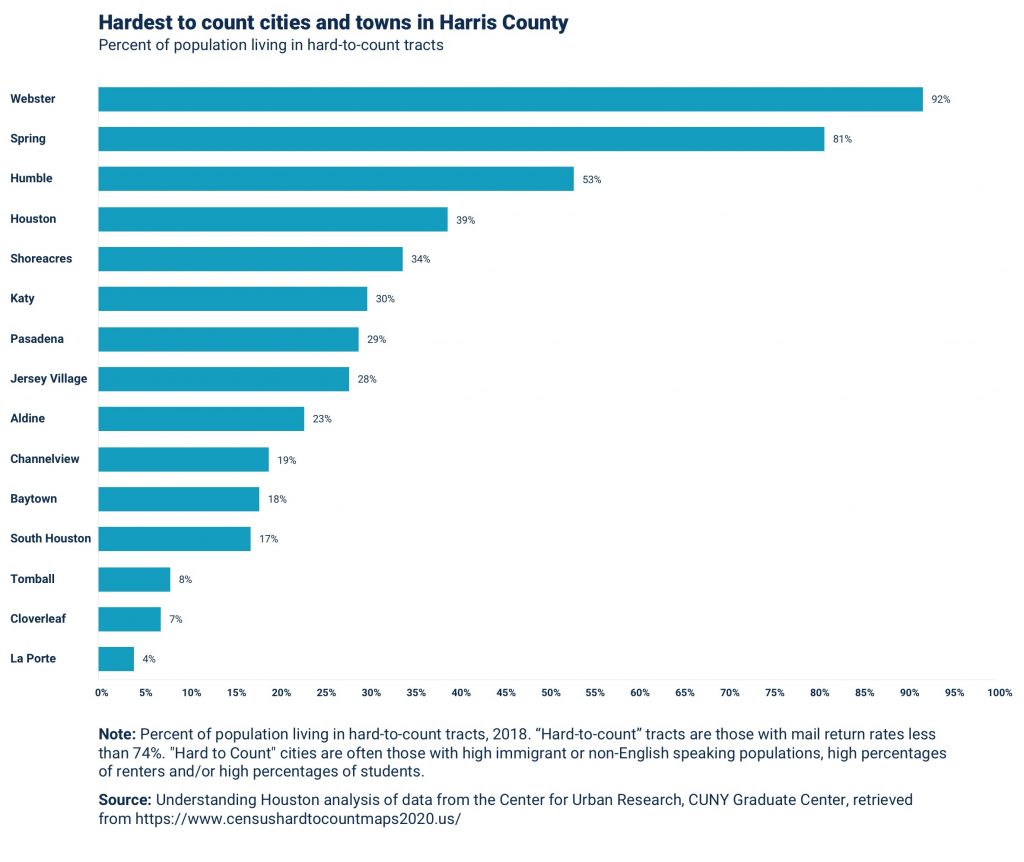
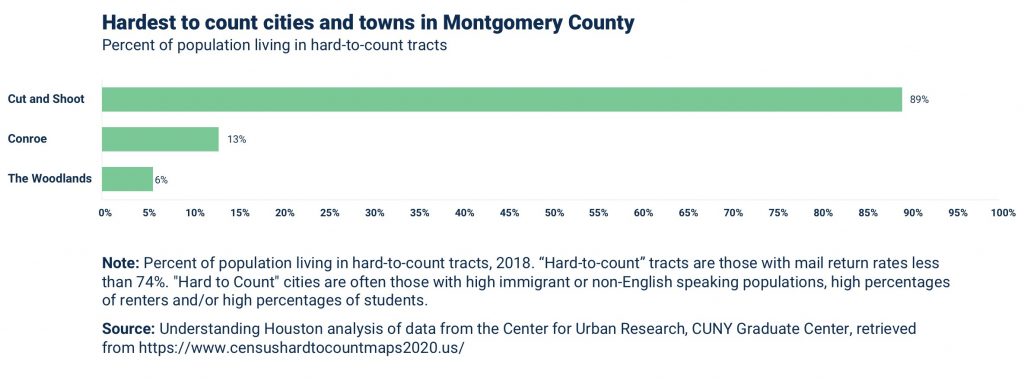
The graphs below show the hardest-to-count cities and towns in the three-county Greater Houston area.
Percent of population living in hard-to-count tracts
In Fort Bend County, 100% of residents of Kendleton, Orchard, and Fifth Street live in census tracts with sub-standard response rates. Webster and Spring are hard-to-count communities in Harris County, and 89% of residents live in hard-to-count tracts in rural Cut and Shoot, Montgomery County. Explore the hardest-to-count communities using this interactive map from the Center for Urban Research at City University of New York.
Accurately counting these hard-to-count communities requires additional investment. During the 2019 legislative session, Texas policy makers neglected to dedicate funds toward an accurate census count, in contrast with states like California, which has invested $187 million in ensuring a complete count. Instead, Harris County and the City of Houston have spent $5.1 million from their own budgets toward local census outreach and communication efforts. Houston In Action has been leading community-level outreach with an eye toward “cultural competency,” attempting to meet hard-to-count groups where they live, work, and play. Since the emergence of COVID-19 has required most of us to live, work, and play at home, outreach efforts have been delayed and redesigned, exacerbating challenges to a complete count, especially among historically hard-to-count groups.
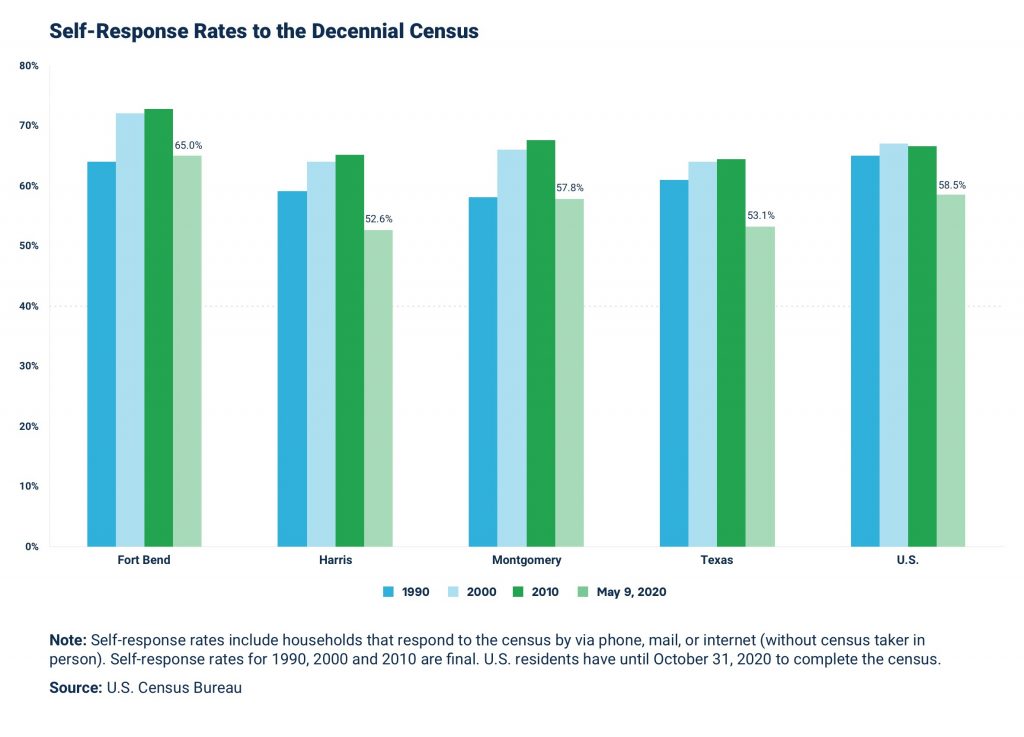
Texas and the Houston region’s census self-response rates
Given the number of hard-to-count populations in our region, coupled with the state’s lack of investment in census outreach, it’s not surprising that Texas historically trails the country in taking initiative to respond to the census.4 In the 2010 census, the national self-response rate was 66.5%, compared to 64.4% among Texans. Texas, the second most populous state, ranked 34th among states on this measure.
Harris County — the third most populous county in the nation — doesn’t do much better than the state. Not quite two-thirds of households in Harris County responded to the 2010 census, placing Harris 15th among the 25 most populous counties in the nation in census response rates. Conversely, Fort Bend and Montgomery Counties are high performers. In 2010, Fort Bend County had the second-highest response rate in the state at 72.1%. Montgomery County ranked 17th at 67.5%. For comparison, Harris County was 38th in Texas.
History is repeating itself as Texas continues to lag behind the overall national response to the ongoing 2020 census, ranking 38 among states at time of publication. As of May 9, the national response rate was 58.5% while Texas lags at 53.1%. Among the three-county Greater Houston area, Harris County trails with a response rate of only 52.6% while 65.0% of Fort Bend households have completed the census.
How you can help Houston count
An accurate census count is incredibly important for our communities, and being counted can be surprisingly simple. Help by completing the census if you have not already. For most, the process takes about 10 minutes and can be completed online, by phone, or through the mail. Details below. Also, please consider supporting Houston in Action’s census outreach efforts in a variety of ways.
Online: Visit my2020census.gov to fill out the census questionnaire.This is the only website you should use to answer census questions.
By phone: For English speakers, dial 844-330-2020, and for Spanish speakers, dial 844-468-2020. The Bureau also offers 11 other languages. For a full list of phone numbers by language, visit www.2020census.gov/en/ways-to-respond/responding-by-phone. The phone lines are open every day from 6 a.m. to 1 a.m. Central Time.
By mail: Most households should have received their invitation to respond to the 2020 Census as of March 20. The invitation contains information on how to respond and a Census ID for completing the census online. Homes in areas that are less likely to respond online will eventually receive a paper questionnaire.
The Census Bureau will never ask for a Social Security number, bank or credit card account numbers, money or donations, or anything on behalf of a political party. In 2020, it also will not ask for citizenship status; all U.S. residents regardless of immigration status may fill out the census.
Deadline: While the deadline to complete the census has been extended to October 31, 2020, why wait? Do it now. April 1 is considered Census Day, as this is the day for which we complete the survey for all people living at your residence on that day.
If you’ve already completed the Census, there are still ways you can help the Houston region be counted.
Houston in Action has assembled a Census Toolkit featuring a suite of free resources designed to connect vulnerable and hard-to-count populations with the information they need to complete the 2020 census.
The City of Houston offers a variety of free-to-share materials you can use to help educate friends, neighbors, and loved ones about the importance of the census — including email templates, social media graphics, children’s materials, and more — in six of our region’s most common languages.
The months and years following the COVID-19 pandemic will bring many new and unique challenges to our region. Don’t let Houston leave critically-needed money on the table. Be counted. Spread the word to your friends and neighbors. Let’s count all of Houston together.
End Notes:
1 Learn more about how the federal government distributes funds here. 2 An analysis of five major programs administered by the U.S. Department of Health and Human Services that comprise about 48% of funds states receive from the federal government. Visit GWIPP for more details on methodology. 3 First, households complete the census on their own (either online, by phone, or via mail). If, after multiple reminders, the household has not responded, a census taker makes a house call to collect responses in-person. As a last resort, the Bureau derives estimates using administrative records from the Internal Revenue Service or Social Security. Learn more about how the Census Bureau counts difficult-to-reach populations here. 4 Self-response rates are different from final response rates. Self-response includes those who respond on their own initiative online, by phone, or via mail. Final response rates include responses received in-person as a result of households being unresponsive.
Neighborhoods matter. Where we live has a profound impact on our lives in ways we don’t always understand.
Maps and dashboards that provide quality-of-life data at the neighborhood-level are a key piece to the puzzle of understanding communities. Understanding Houston focuses on county-level data to measure how the region performs overall and across time, but we know that place matters when it comes to moving the needle for the whole region. That’s why we have curated a list of special tools that help you understand Houston’s neighborhoods a little better.
Houston Community Data Connections (HCDC) from Rice University’s Kinder Institute for Urban Research
The tool
HCDC launched in 2017 to arm community leaders with data to inform planning and decision-making. The site contains a robust online dashboard that provides neighborhood-level indicators for Harris County and a research gallery of interactive data stories on a variety of topics related to demographics, housing, poverty/income and more. The dashboard allows users to overlay various indicators on a map, view detailed community profiles, and compare neighborhoods to one another and over time.
This tool is excellent if you want to create maps to include in your presentations and want a quick profile of a particular neighborhood. We also love how the interactive data stories present a variety of data in context with analysis on fascinating topics. Be sure to view the FAQs and training guide before beginning to get the most from this tool.
Opportunity 360 from Enterprise Community Partners
The tool
Opportunity360 Community Dashboard offers a comprehensive view of any neighborhood in the country by measuring five foundational criteria shown to have the greatest impact on how we live: housing stability, education, health and well-being, mobility, and economic security.
Why we love it
The Opportunity360 Community Dashboard offers more than 150 indicators from 27 sources and can compare up to three census tracts at one time. Users request dashboards by entering a location or address and then receive the dashboard via email. The interactive dashboard allows users to export data, filter visuals, print, and hyperlink to specific sections. Be sure to check out Opportunity360’s list of resources, FAQs, and methods. Opportunity360 also offers additional tools, resources, and reports on how other organizations used the data to inform their decision-making and planning, so be sure to explore the website.
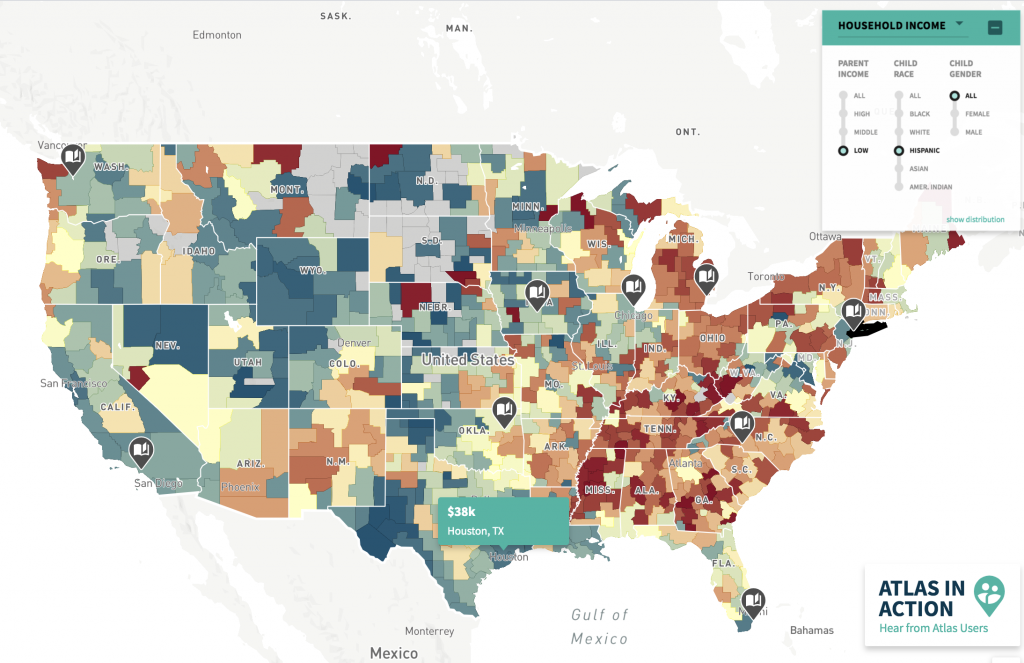
Opportunity Atlas, a collaboration among researchers at the Census Bureau, Harvard University, and Brown University
The tool
Opportunity Atlas is an interactive tool that measures the extent to which groups move up (or down) the economic ladder by looking at various outcomes of adults and back-mapping where they grew up. Users can select which adult outcomes they want to explore (e.g., household income) for a demographic group (e.g., low-income Asian women) by various neighborhood characteristics (e.g., poverty rate).
Why we love it
The census tract-level data reveal insights about communities most likely to produce adults with promising or poor outcomes. The mapping feature allows you to see how neighborhoods in close proximity can produce adults with vastly dissimilar outcomes, or how different groups in the same neighborhood have contrasting outcomes.
Use interactive maps to explore outcomes in health, education, income and more by census tract.
You can download maps as images to include in presentations, download the data itself, and overlay your own data onto the map. Don’t forget to explore interactive stories on the site that are not only insightful, but also give you ideas on how to begin. And, as always, familiarize yourself with the user guide, methods, and FAQs before you begin.
Child Opportunity Index from Diversity Data Kids
The tool
The Child Opportunity Index (COI) measures and maps the quality of resources and conditions that matter for children to develop in a healthy way. It combines data from 29 neighborhood-level indicators into a single composite measure.
Why we love it
Users select a metropolitan area to view census tracts. You can also see where children of different racial/ethnic groups live, compare metro areas, download datasets, and view data stories for greater insights. If you have questions after reading the report, reviewing the technical document, and looking over the FAQs, be sure to contact them.
Houston-Galveston Area Council
The tool
Houston-Galveston Area Council (H-GAC) is a regional organization through which local governments consider issues and collaborate to solve region-wide problems. H-GAC provides extensive research and data to the public through online visual and mapping tools to inform local and regional planning, programming, policy-making, and decision-making.
There is a ton of information here. Depending on availability, data are provided at various geographic levels, including census tracts. Find data and analysis on several topics ranging from employment, environment, land use/planning, transportation including commuting flows and mobility, and population.
Data.census.gov from the Census Bureau
The tool
The Census Bureau is the nation’s leading provider of quality data about its people and economy. The best way to access data collected and prepared by the Census Bureau is through data.census.gov, the Bureau’s new data platform designed for all users – not just researchers. The Census Bureau conducts the decennial census, economic census, demographic surveys, economic surveys, housing surveys, provides population estimates and counts, and produces original research.
You can access demographic data at the zip code, census block, block group, and tract level. Users are able to create maps and manipulate data tables for efficiency. The Census Bureau has provided several resources to help users learn this new platform and hone data skills with their Census Academy. Learning tools include data gem videos, online courses, previously-recorded webinars and upcoming webinars.
Location Efficiency Tools from the Center for Neighborhood Technology
The tool
Location Efficiency Tools are a suite of web-based tools, comparison maps, downloadable data, research reports, and more that can help communities become more convenient and livable. The Center for Neighborhood Technology (CNT) works to improve cities’ economic and environmental sustainability, resilience, and quality of life.
Why we love it
The Housing and Transportation (H+T) Affordability Index, one of the tools, provides a comprehensive view of affordability that includes both the cost of housing and the cost of transportation at the neighborhood level. The website contains four tools (H+T Index map, H+T Fact Sheets, Total Driving Costs tool, and Comparison Maps). There’s a lot of info here too, so be sure to check out the about section to learn more about the data available, read the user guide, and find FAQs.
Making a difference starts with the right information
Whether you’re conducting research for a new proposal or looking for data that can help you better direct your own community efforts, using the right tools to find the best information is always a good first step. And, Understanding Houston is a great place to start. Featuring over 200 indicators on key quality of life issues, Understanding Houston aggregates and analyzes county-level data over time with state and national comparisons.
COVID-19 has upended lives around the globe, and Houston is no exception. We continue to hear the worst is yet to come, but it’s difficult to fully comprehend what that means or take proper action without context. To mitigate the effects of this global public health crisis in our region, we must understand the scope of vulnerability in the Greater Houston area.
While we can’t predict the future of COVID-19, we can use local data to better understand what may be in store for our region so we can take collective action to reduce the risk to the most vulnerable communities.
Want to give back and get involved? Visit greaterhoustonrecovery.org to learn more about the Greater Houston COVID-19 Recovery Fund, and how your support can help our neighbors who need it the most.
The “current” state of affairs
It’s challenging to stay fully informed of the crisis as the number of cases, deaths and recoveries varies depending on when and where you look. Officially, the Centers for Disease Control (CDC) reports more than 304,800 cases in the nation, while the Johns Hopkins Coronavirus Resource Center reports 339,000. The Texas Department of Health and Human Services is tracking more than 7,200 cases in the state as does the Houston Chronicle. What we do know is that the virus has been quietly spreading across the country for several weeks, and these figures are just the beginning.
Following the number of cases and fatalities is a good place to start in understanding the magnitude of the crisis, but it fails to account for the deeper ramifications COVID-19 may have for different people in our region. As with other disasters, the most vulnerable populations will be disproportionately affected. In this brief, we aim to identify and quantify vulnerable groups in our region that COVID-19 will impact in a variety of ways. While this is by no means an exhaustive list, we hope it informs our collective response in assisting those who need it most.
COVID-19 and health risks in the Houston area
At publication time, more than 72,000 people around the world have died from COVID-19 — nearly 15% of whom were Americans. While hospitalization figures are inconsistent among states, the COVID Tracking Project reports more than 41,500 cumulative hospitalizations across the nation. Of course, the novel coronavirus poses significant public health risks, but for some, the risks are much higher.
Older adults
CDC researchers found that COVID-19 fatality rates increase with age, particularly for those over the age of 65. Death rates for Americans 85 years and older range from 10% to 27%, followed by 3% to 11% among persons aged 65–84 years, 1% to 3% among persons aged 55–64 years, and less than 1% among persons younger than 20. These findings are consistent with data from the first two months of 2020 in China.1
More than 660,000 adults over the age of 65 live in Fort Bend, Harris, and Montgomery counties. Worse, more than 134,000 (about one in five) live alone, with particularly high concentrations in Fort Bend County. Given their heightened vulnerability to the effects of COVID-19, older residents who live alone may face additional challenges safely obtaining the supplies and resources they need in order to practice social distancing. We also know that 134,000 seniors live below 150% of the poverty level, further hindering their ability to weather this crisis.
People with chronic health conditions
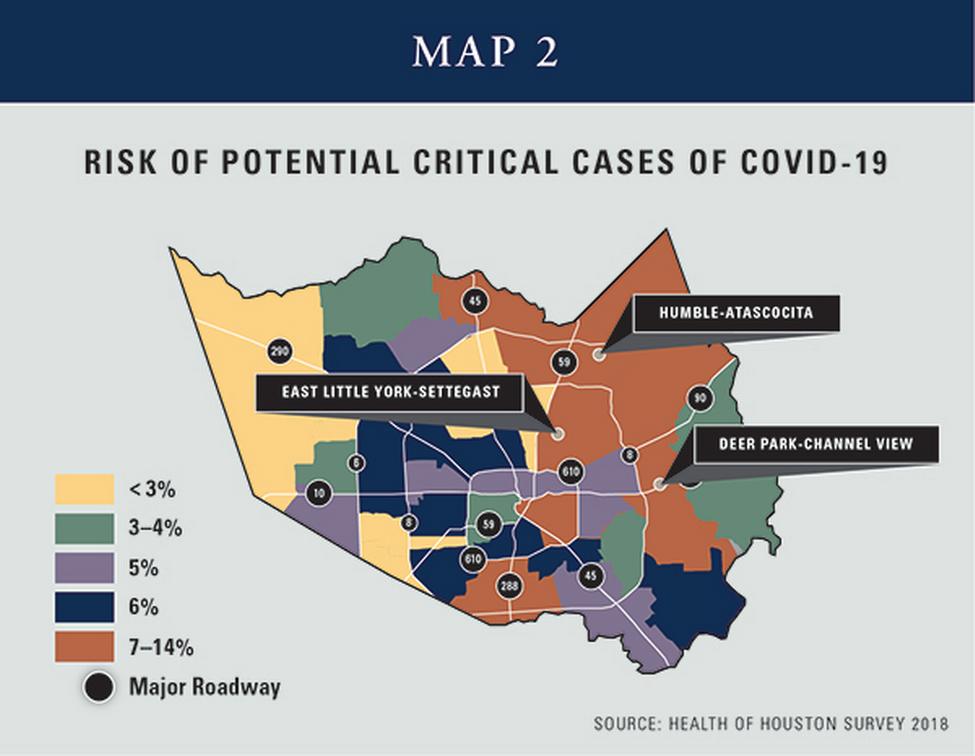
People with chronic health conditions like diabetes, compromised immune systems, heart disease, and asthma are also at higher risk of contracting and succumbing to COVID-19. The Institute for Health Policy at UT Health Science Center of Houston conducted an analysis of Census data in Harris County to map individuals with the highest risk for hospitalization and critical care needs. UTHealth researchers found that areas with the largest proportions of residents at high risk of critical illness from COVID-19 include Deer Park-Channel View, East Little York-Settegast, and Humble-Atascocita.
The areas of Harris County where residents are mostly likely to need critical care for COVID-19 are shown in orange. (Photo by Heath of Houston/UTHealth)
Take a deeper look: Explore this interactive map to see how these and other risk factors correspond to confirmed COVID-19 cases in Harris County.
Uninsured
No one wants to get sick, but for those without health insurance, the stakes are even higher. The Houston Metropolitan Area is home to the largest number of uninsured in Texas, which has the largest number and rate of uninsured in the country. Workers without health insurance are most likely to be part-time, gig economy, or low-wage employees, which means they likely do not have paid sick leave, compounding risks.2
President Trump signed the “Phase 2 Stimulus Package” (the Families First Coronavirus Response Act) on March 18 which provides free testing, but individuals will still be responsible for paying their treatment costs. This could affect some of the more than 1.1 million people, including 184,300 children, in the three-county region who are uninsured.
Mental Health
Harris County issued the first stay-home order effective March 17, but many of us are into our third or fourth week of staying home. The mental and emotional toll of COVID-19, for even the least vulnerable among us, will only continue as the pandemic wears on. Anxiety about the health of loved ones and ourselves, isolation, loneliness, and joblessness can all wear down our sense of well-being as the outbreak’s severity increases.
Coronavirus-related stress likely exacerbates pre-existing mental health conditions and mental health care access challenges in our region. As of 2018, the percentage of adults experiencing frequent mental distress (14 or more days of poor mental health within a month) in Houston’s three largest counties ranged from 9% in Fort Bend County to 12% in Harris County, where more than half of confirmed Houston-area cases of COVID-19 have been reported.
While those who have access to mental health care may be able to continue treatment through remote appointments, many in the Greater Houston region lack access to care altogether. As of 2018, Houston’s three largest counties average one mental health care provider for every 988 residents, lower than the state average and less than half the national average.
Economic risks of COVID-19 in the Houston area
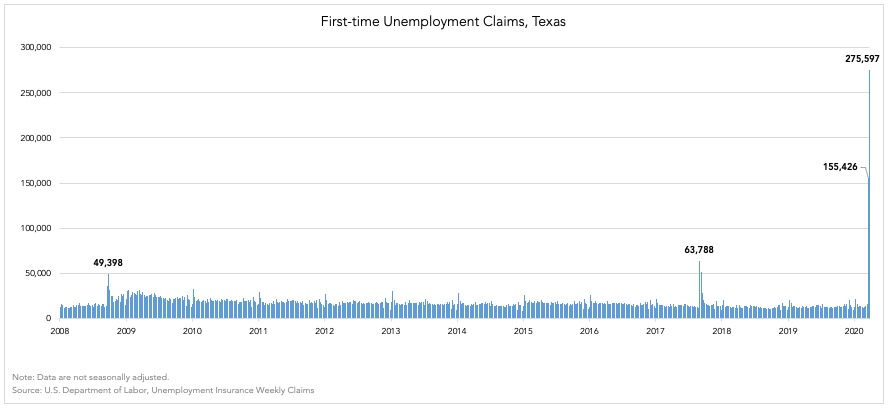
Layoffs due to COVID-19 have begun throughout the Houston area, adding to challenges in healthcare access, mental health and more. Nearly 10 million Americans have filed for unemployment for the first time in the past two weeks, more than 431,000 of whom are from Texas. For the first time, the CARES Act expanded unemployment benefits and loans to these workers, but the process to connect people to these resources in a timely manner will be challenging.
As the graph below shows, these figures are unprecedented. Patrick Jankowski, senior vice president of research at the Greater Houston Partnership estimates mid-March job losses are nearly 38,000 in Metro Houston, though those figures can’t be confirmed until jobs data come out in early May.
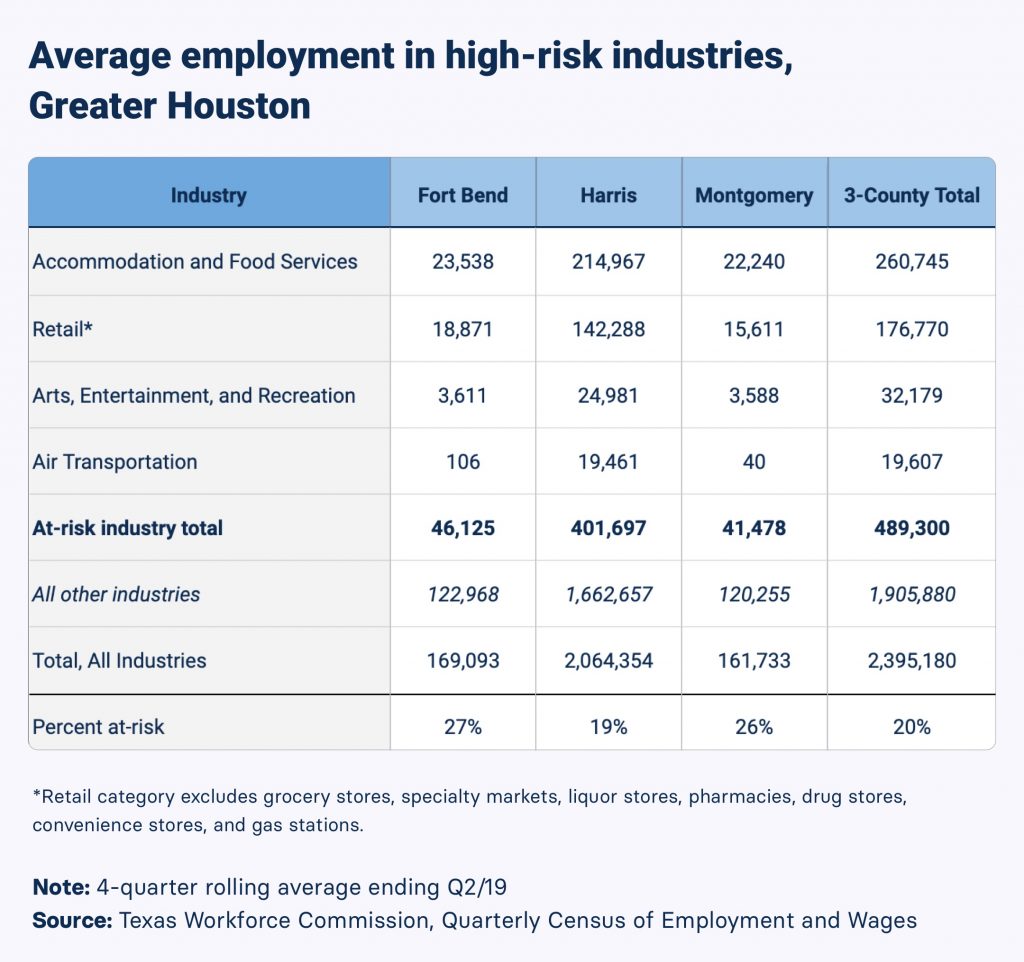
High-risk industries
The majority of unemployment claims are from workers in the service industry — hotels, bars, restaurants, entertainment, leisure — as well as retail and travel. One out of every five workers in the three-county region is employed in a sector at high-risk for job loss, totaling about half a million people. Houstonians in these high-risk industries earned nearly $4 billion in wages in the second quarter of 2019.
While these industries are at immediate risk from the economic effects of COVID-19, the steep decline in oil prices will have longer-lasting and wide-ranging implications for businesses and workers in the oil and gas industry. Houston, as the energy capital of the world, will certainly be disproportionately affected.
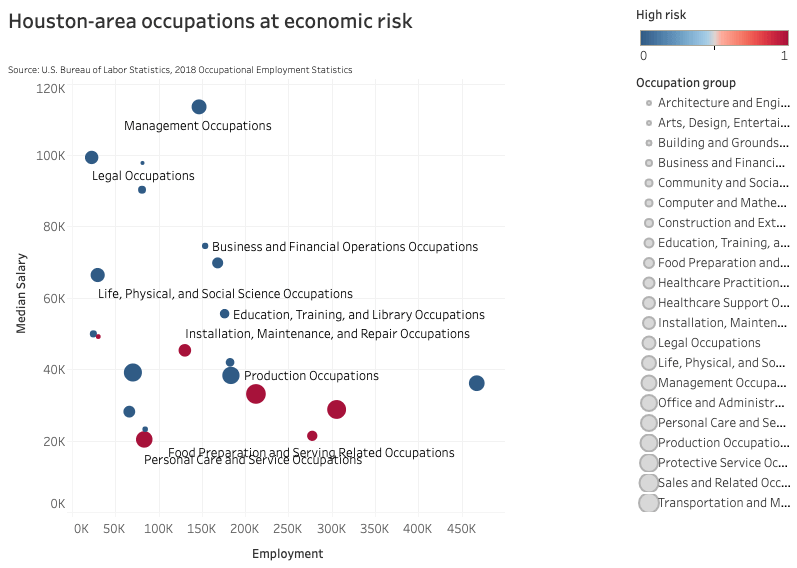
Low-wage workers
Not all occupations in the aforementioned industries are at risk for layoffs. National data show that low-wage, part-time, and hourly workers in specific sectors have been hit the hardest with job and wage losses. The graph below shows the number of jobs and median annual salaries for workers grouped by job function. Occupations that are most at risk (in red) have the lowest salaries. Traditionally, that also suggests workers are paid hourly, don’t have health insurance, and don’t receive paid sick leave. Many groups will be eligible for paid sick leave and unemployment benefits offered by the federal government’s response to COVID-19, but not all, and workers will still have to make the difficult choice between protecting their health or earning an income. The stakes are high as 40% of Houstonians don’t have $400 in savings to deal with an unexpected emergency.
Small businesses in particular are struggling as everyone is told to stay home, and revenue has plummeted as a result. Nearly 127,000 small businesses employ fewer than 500 people in our region and comprise half of Houston-area businesses—most of these (89,500) employ fewer than 10, according to U.S. Census Bureau County Business Patterns. About 38 percent of small businesses in our region are minority-owned, putting livelihoods at risk and compounding challenges minorities have historically faced.
A survey by the Greater Houston Partnership shows that 91% of its small business members (defined as 500 or fewer employees) have lost revenue, about half are not able to pay staff during the shut-down, and more than one-third have laid off workers. There is hope that recent federal legislation will slow some of the job losses as small businesses take advantage of the Paycheck Protection Program (PPP), which requires companies to use the majority of funds to continue to pay staff.
Vulnerable populations in the Houston area
In addition to the groups identified above, immigrants, those who experience homelessness, and school-aged children are especially vulnerable to the hardships caused by COVID-19. In general, residents who were struggling prior to the pandemic will face compounded economic hardship during the crisis. This includes individuals and families living in poverty and low-income working households, also called Asset-Limited, Income-Constrained, and Employed (ALICE). Again, what follows is not a complete list, but we hope to call out examples of people in our community who will need the most help.
Immigrants
Immigrants, especially those who are undocumented, are particularly vulnerable to crises like disasters and pandemics. Immigrants tend to have less access to information and services since they may not be as familiar with credible sources, or with knowing how to navigate the system, and are more likely to encounter language barriers.
More than 1.5 million Houstonians were born outside the U.S. but call the three-county region home—that’s one out of every four people. The Migration Population Institute estimates 473,000 undocumented immigrants live in Greater Houston. According to the Census Bureau, more than half of immigrants in the region speak English less than “very well.” A recent report from ProPublica highlights the obstacles limited English proficient speakers encounter trying to advocate for their medical care. Given there are more than 145 languages spoken in the region, the need for interpreters and translators right now is critical. To view a map of where immigrants live in Houston, click here.
Immigrants also tend to have less access to forms of federal and state assistance (even though most pay taxes) because they are typically excluded from government programs and they are less likely to take advantage of aid for which they are eligible. Compounding their vulnerability, immigrants are more likely to be uninsured and work low-paying jobs. They are also over-represented in sectors immediately affected by layoffs. Ironically, an analysis by the Migration Policy Institute found that six million immigrant workers are at the front lines of keeping Americans healthy and fed during the pandemic by working in hospitals, as care-givers, or on farms.
Immigrants without legal status will have an even harder time weathering this pandemic as they are not eligible to benefit from the trillions of dollars in aid the federal government is releasing. In fact, the CARES Act, the $2.2 trillion stimulus package signed by President Trump on March 27, explicitly excludes them. Even mixed-status tax-paying households where American-born children have at least one parent without legal status will be ineligible for benefits.
Those who are homeless
People experiencing homelessness are particularly vulnerable during this pandemic. Homeless individuals tend to be older, and are more likely to suffer from mental illness and chronic conditions, making them more susceptible to the virus. Additionally, it is nearly impossible to follow CDC guidelines regarding social distancing, staying home, and regular hand hygiene without a permanent residence.
A marginalized population in the best of times, the unique needs of these individuals are often deprioritized in times of crisis. According to 2019 data from the Coalition for the Homeless, nearly 4,000 sheltered and unsheltered people live in Fort Bend, Harris, and Montgomery counties. Houston Mayor Sylvester Turner announced on April 1 that the city will rent hotel rooms to shelter Houston’s homeless individuals, but this population will require much more support as this crisis continues.
School-aged children
While school districts in Texas are officially closed through May 4, many parents are preparing for schools to remain shuttered for the remainder of the academic year. Several organizations, districts, teachers, and parents have stepped up to ensure that children continue to learn, but with parents working from home and the general chaos COVID-19 has created, maintaining a high-quality education at home is challenging, particularly for low-income working parents and those without internet access or computers. For example, recent data from Los Angeles Unified (LAUSD), the second-largest school district in the country, show that about 15,000 high school students are absent online and have failed to do any schoolwork, and more than 40,000 (about one-third of all high schoolers) have not been in daily contact with their teachers since mid-March, suggesting that distance-learning is not reaching everyone.
Moreover, when students spend time away from school during the summer, they sometimes lose what they learned over the academic year, a concept known as “summer slide.” One study found that students lost between 25% and 30% of what they learned during the school year, with lower income students at a greater disadvantage than their wealthier peers. About 691,500 public school students (62% of students enrolled) in the three-county region are identified as economically disadvantaged, meaning they qualify for free or reduced-price lunch. For many children, these free or reduced-price school meals are their primary source of daily nutrition. And, for the 98,000 students with disabilities and special needs in our region, the consequences of being out of school for a prolonged amount of time could be even more serious.
Understanding challenges to help Houston move forward
COVID-19 may be the first pandemic any of us have lived through, but this is far from the first time Houstonians have dealt with adversity. We’ve seen how this community comes together — neighbor helping neighbor, stranger helping stranger. For the good of this region that we all call home, please stay home if you are able. The more we reduce our physical contact with each other, the more neighbors we can save. That, if anything, is clear.
There are still plenty of ways to help from home. The United Way of Greater Houston and the Greater Houston Community Foundation have established the Greater Houston COVID-19 Recovery Fund, endorsed by Mayor Sylvester Turner and Harris County Judge Lina Hidalgo, to support local nonprofits that help those we identified here and more. Visit greaterhoustonrecovery.org today to see how you can get involved.
Smart Parents, an informational hub for Texas families and regional nonprofits
End Notes:
1 The same CDC study found that while fatality rates might be very low for young people, they are not entirely immune to the effects of COVID-19 — nearly 40% of those hospitalized for coronavirus from mid-February to mid-March were between the age of 20 and 54. 2 Recent federal legislation allows for paid sick leave.


