What can Houston learn from Charlotte’s economic mobility journey?
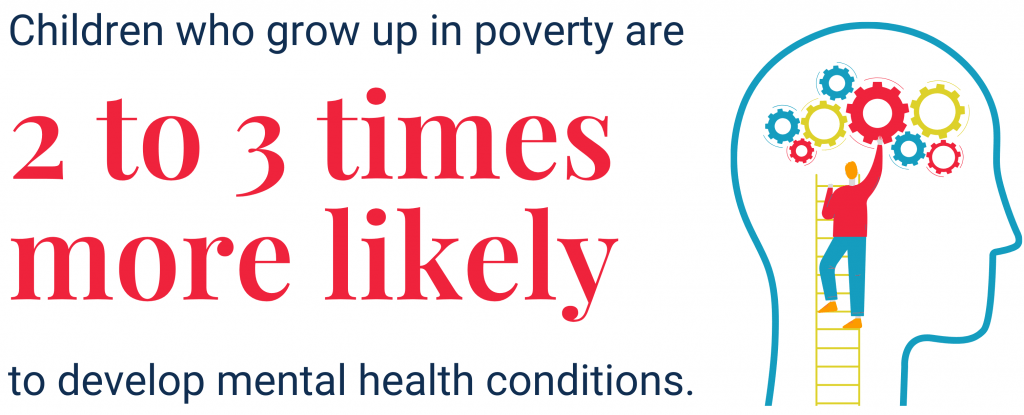
Houston is at an inflection point. It’s one of the most diverse and fastest-growing regions in the country with a dynamic economy that accounts for more than a quarter of Texas’s total Gross Domestic Product (GDP) and job growth that consistently outpaces the national average. But significant gaps remain in who benefits from that growth. Economic mobility indicators in the region have stalled, nearly half of Houston-area residents struggle financially, fewer than 20% of high school students will earn a living wage six years after graduation, and last year Houston ranked as the city with the highest poverty rate among the 25 most populous U.S. cities.
Charlotte, North Carolina knows this tension well. Over a decade ago, despite a booming economy, Dr. Raj Chetty and his colleagues at Opportunity Insights ranked Charlotte last (50th out of 50 regions) on children’s ability to improve their economic standing relative to their parents.
What happened next is worth learning about. Charlotte rallied cross-sector leader, centered community voice, and built a data-driven strategy sustained over the years by Leading on Opportunity. When Chetty’s team released updated findings in 2024, Charlotte climbed from 50th to 38th and ranked third most improved in the country.
Charlotte’s story shows what can happen when a city confronts hard truths with urgency, aligns leaders across sectors, and uses data to drive long-term action. For Houston, where opportunity is also shaped by housing, education, transportation, and family stability, Charlotte offers a practical example of how shared measurement and sustained collaboration can help move a region forward.
Data created the urgency Charlotte needed to act
In 2014, Charlotte was a city where business was booming. People from across the country were drawn to this metropolis where jobs, especially in the financial sector, abounded and the cost of living was relatively low compared to other major cities. The skyline was (and still is) dotted with cranes, as construction to keep up with new housing demand seemed ubiquitous. On the surface, the Queen City seemed to be in its prime with no sign of declining in the future.
That same year, however, Dr. Raj Chetty and his colleagues with Opportunity Insights at Harvard University published the study, “Where is the Land of Opportunity? The Geography of Intergenerational Mobility in the United States,” which ranked the top 50 biggest U.S. municipalities from best to worst in children’s ability to improve their economic standing compared to their parents. Charlotte, despite its glossy high rises and burgeoning Eden of beer gardens, placed 50th out of 50 on this list. The children born here were the least likely to do better than their parents when compared to every other major metropolis in America.
Charlotte ranked last in economic mobility among the 50 biggest U.S. municipalities in the U.S.
For some in Charlotte, especially those for whom this statistic was reflective of their daily life, this publication was not shocking. Investments to make Charlotte seem appealing to a middle-to upper-middle-class transplant population were not the same ones needed to guarantee a living wage or make housing and transportation accessible or affordable. For others, however, and particularly those in civic leadership positions, this publication shone a light on a reality that wasn’t part of the public Charlotte narrative. The study galvanized political will, bringing together executives from across sectors to find a way to tackle the nebulous issue of economic mobility.
Leaders across sectors chose to act, together
A task force was formed, conducting a thorough study of Charlotte and the challenges facing families who are trying to make ends meet and set their children up for success. Made up of government, nonprofit, corporate, and community leaders, this task force published a report in 2017 that outlined a myriad of goals Charlotte would need to achieve to improve the lives of working-class individuals.
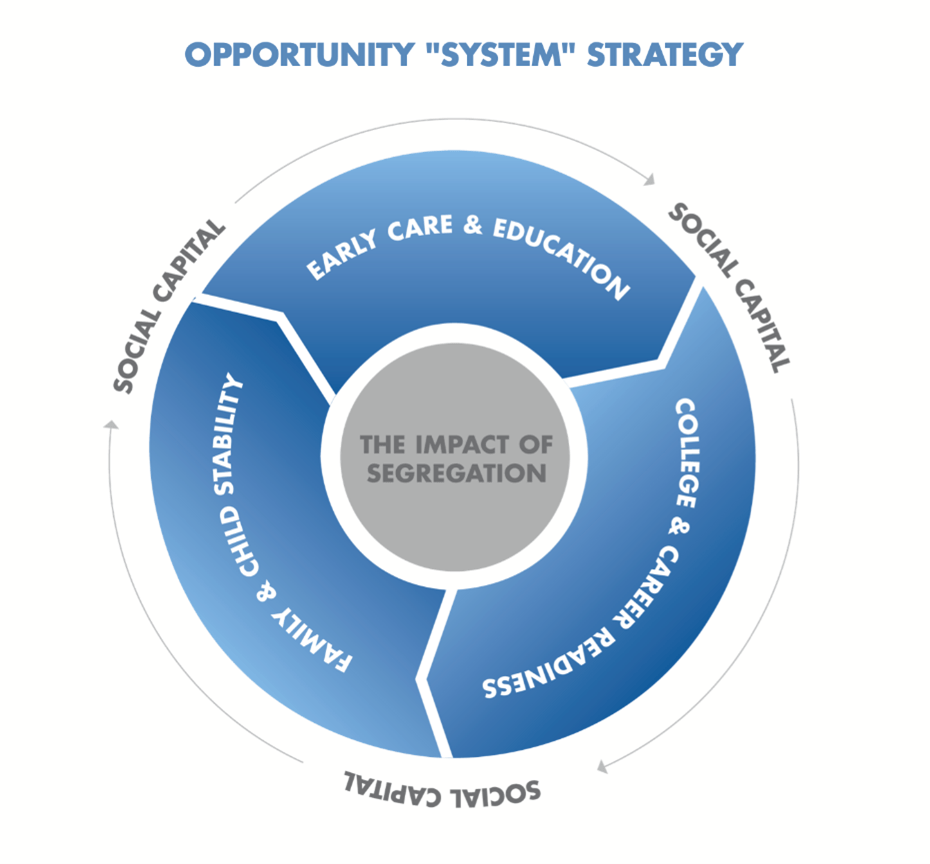
The task force established a framework that focused on the three determinants of economic mobility: Early Care & Education, College & Career Readiness, and Child & Family Stability, with the two cross-cutting factors of the Impact of Segregation and Social Capital, which intertwine with and impact each of the three determinants.
The task force created Leading on Opportunity (LOO) to hold the community accountable for working towards the goals outlined in its report. Since 2017, LOO has helped Charlotte keep its eye on the ball, coordinating collaboration across sectors to improve outcomes for children and families. LOO’s unique approach to systems change unites the pillars of data, strategy, and policy to create a path forward out of complex issues.
Building a tool to track Charlotte’s progress
Data has been one of the biggest underpinnings of LOO’s approach to changing the lives of Charlotteans. Chetty’s 2014 report may have kickstarted the conversation locally, but Charlotte would not be able to rely on their work year over year to track our progress. The city needed a way to document changes in key metrics that have been proven to have an impact on children’s ability to grow up to live stable, thriving lives.
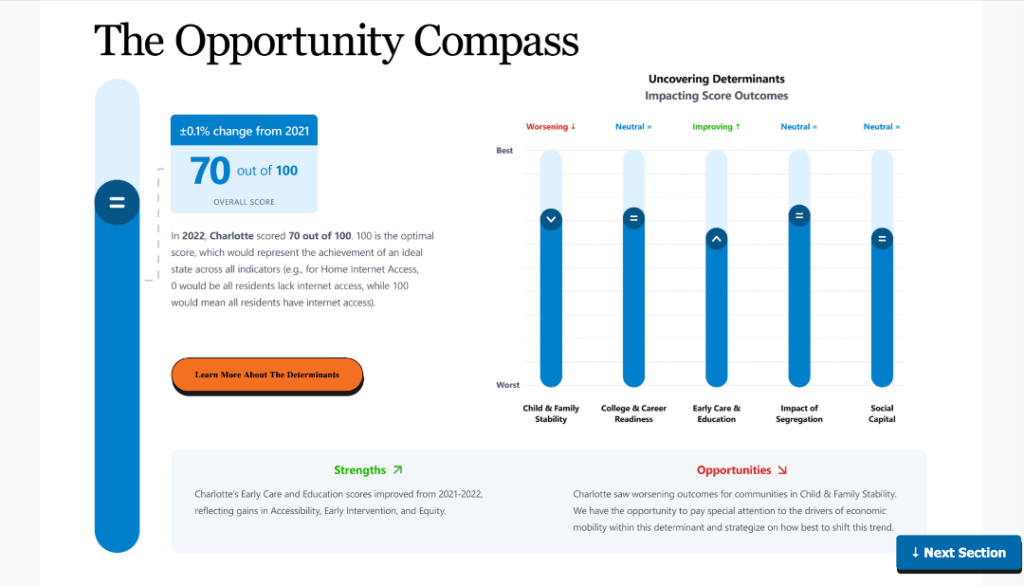
Enter the Opportunity Compass, an online data tool that tracks local performance on key indicators ranging from parity in high school graduation rates to proximity to grocery stores to the ratio of staff to children at early childhood facilities. The Opportunity Compass tracks over 80 quality-of-life indicators in Charlotte, but what is most important about this dashboard is how it is organized and how each of the indicators connects to one another.
This data tool is structured into three tiers. At the broadest level are the five determinants: unifying categories of factors that research has shown drive economic mobility (Child & Family Stability, College & Career Readiness, Early Care & Education, etc.). Each determinant provides an index value summarizing Charlotte’s overall performance within that determinant, giving leaders a high-level read on how trends are moving over time. Are things improving or getting worse within this determinant?
Each determinant is made up of several drivers: smaller subcategories within that determinant that help users zoom in on a particular subject within a determinant, like healthcare access or housing. Finally, each driver is measured by a set of indicators, which are concrete, trackable data points. For example, the degree attainment driver includes indicators such as the rate of young adults with postsecondary education, college graduation rates, etc.
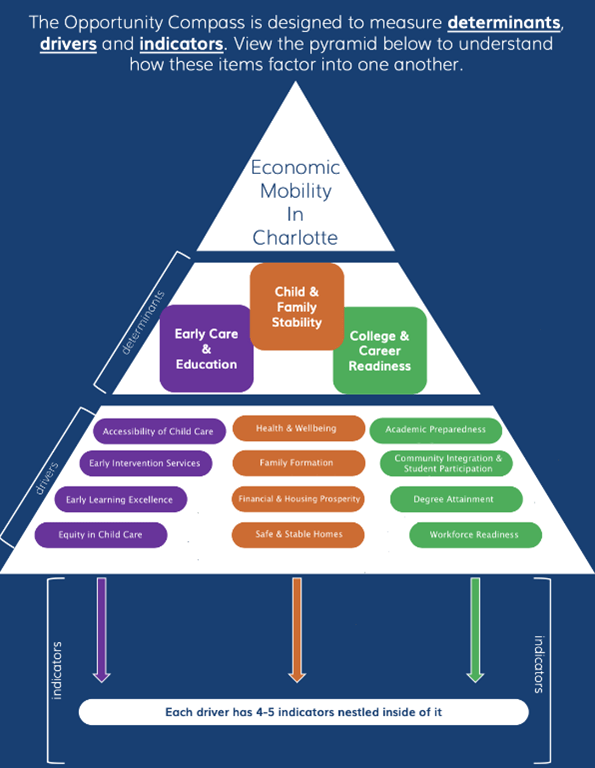
Crucially though, as indicators roll up into drivers and drivers roll up into determinants, not every indicator carries the same weight. The weighting of the indicators is determined by community voice.
Community members across the county have been invited to share their opinions both through in-person sessions and online surveys to determine which factors matter most to the people living these realities. The data from these surveys is then used to weigh the indicators based on what community members say are most important for a child’s ability to get ahead.
The Opportunity Compass is designed to give long-range information about trends in economic mobility. While year-over-year data matters, what makes this tool special is that it is its longitudinal approach, formulated with the understanding that issues of deep-rooted inequality are inveterate and branching.
Knowing the problem made solving it possible
As a crash course on the applications of the Opportunity Compass, we can look first at the determinant of Child & Family Stability: 26 different indicators are tracked across the subcategories, or drivers, of this determinant. Building up one indicator at a time, we not only get the granular data of that particular metric, but we see how it connects to other related factors.
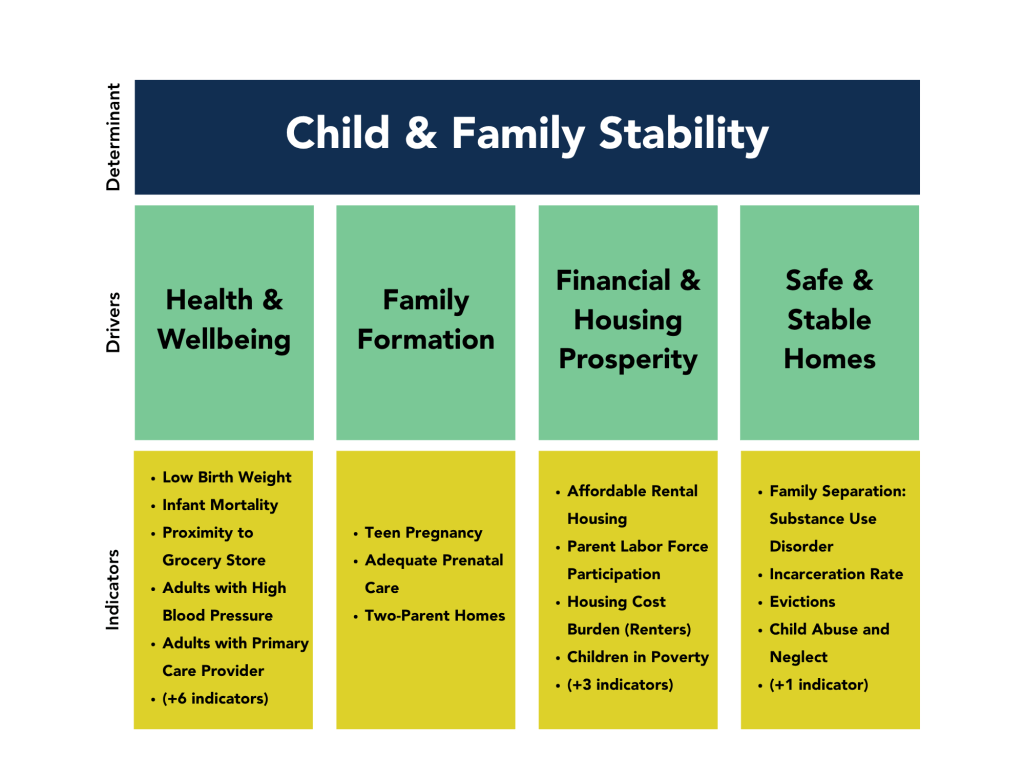
When looking at the indicator tracking evictions, for example, we see that there is an overall decrease in the percentage of evictions granted out of all evictions filed in Mecklenburg County between 2014 and 2022.
This indicator, which is situated within the driver of Safe & Stable Homes, sits among the other metrics of incarceration rates, incidence of child abuse and neglect, family separation because of substance use, and students receiving services for housing instability.
Altogether, these indicators combine to generate an overall trend in Safe & Stable Homes (currently scoring a 78.0%, which is down from 2021 but up from a score of 74.7% in 2014).
The weights given to each indicator are based on the importance assigned to it by community members from across Mecklenburg County. These scores, building up from the most granular at the indicator level to the broadest at the overall Compass level, help us trace the tides of economic mobility on both a micro and macro level. It also enables us to watch how policy changes, like a freeze on evictions, have a direct impact on outcome data.
This housing data, as a larger part of Child & Family Stability, helps illustrate the long-term trends in economic mobility across the past decade. When it comes to housing, advocates and civic leaders have been watching the constraints on affordable housing that come with rising property values and neighborhood change that have forced some longtime Charlotteans out of their homes. The eviction indicator shows some of the precarity that renters are facing, and the steady decline in affordable rental housing (displayed below) helps to flesh out the constraints existing for many people looking to find a home in Charlotte.
With these factors in mind, leaders from across sectors have worked to increase affordable housing stock in Charlotte-Mecklenburg. The Housing Trust Fund, which was first established in 2001, has been exponentially expanded, with one important win in November of 2024, when voters approved an increase from $50M to $100M in funds to be dedicated to the creation of more affordable housing.
In this case, both public and private sector officials understood that the trends in housing, particularly around affordable housing stock, required an influx of capital, and that if no investment were made, the impact on housing would bleed into other indicators, eventually affecting outcomes across the determinant of Child & Family Stability and the Opportunity Compass as a whole.
The data we have today underscores the importance of acting sooner rather than later to invest in housing and avoid the fallout (physical, emotional, and financial) of having to scramble to provide emergency housing services on the back end. Civic leaders continue to leverage this data to make the case for increased funding where it matters.
Providing data to the decision makers
This in-depth analysis of the workings of the Opportunity Compass highlights the vast array of data underpinning the strategy and policy recommendations arising from work around economic mobility in Charlotte. With a grounding in robust knowledge of the ongoing struggles to secure housing, childcare, health care, transportation, jobs that pay a living wage, etc., LOO feels more equipped to advise decision makers on the right next steps.
Coordinating higher education leadership
With the understanding that collectively, individuals and organizations can have a much bigger impact, LOO launched the Crescent Coalition, a group of eleven college-access organizations dedicated to getting students to and through college. Together, these organizations were able to serve more students and provide more expansive programming, including a Beating the Odds Summit designed to fight “summer melt,” or graduating high school seniors who enroll in college but do not end up matriculating. Coordinated efforts have united the city around making tangible changes in the lives of kids growing up in Charlotte-Mecklenburg.
Policy changes to improve transportation infrastructure
At LOO, we understand that, ultimately, policy shapes the landscape within which we all work. With the data in mind and our co-collaborators by our side, we have advocated for critical policy changes that will improve conditions for folks locally. Most recently, in November 2025, Mecklenburg residents voted to increase sales tax by 1% to support a massive investment in transportation infrastructure. This tax will generate about $19.4 billion over 30 years to support a new transit plan that greatly expands public transportation options, including an extension of bus and light rail services.
A decade of impact with work remaining
What started with a study that rocked Charlotte’s narrative around being a business boomtown turned into a call for long-standing commitment to an investment in changing outcomes for children growing up in Charlotte. In 2024, we got confirmation that we are on the right track: Chetty and his colleagues released an update of the study on the geography of economic mobility, and Charlotte moved from 50th to 38th place, also ranking third most improved.
In 2024, Chetty and his colleagues shared that Charlotte moved from 50th to 38th place in economic mobility, also ranking as the third most improved region.
While this study is still a retrospective in that it tracks the economic outcomes of children born in the early 1990s (not present-day), it is affirming to see that the work of civic leaders at that time, with many investments in the public sector, had a tangible impact, much in the way leaders of today hope that their investment in this work will bring about positive change.
This work is not over. With a rapidly shifting policy landscape and families confronting urgent needs when it comes to securing housing, childcare, transportation, and jobs that preserve dignity and pay a living wage, the call to continue fighting for economic mobility rings louder than ever.
Organizations and individuals alike will have to get creative as old ways of working in this space no longer exist. While new solutions may in this moment feel elusive, we know that a bedrock understanding of the data driving an issue, together with a strategy knitting together the key stakeholders, are critical to making lasting policy change that will restructure the inequalities we currently face.
Stay Informed
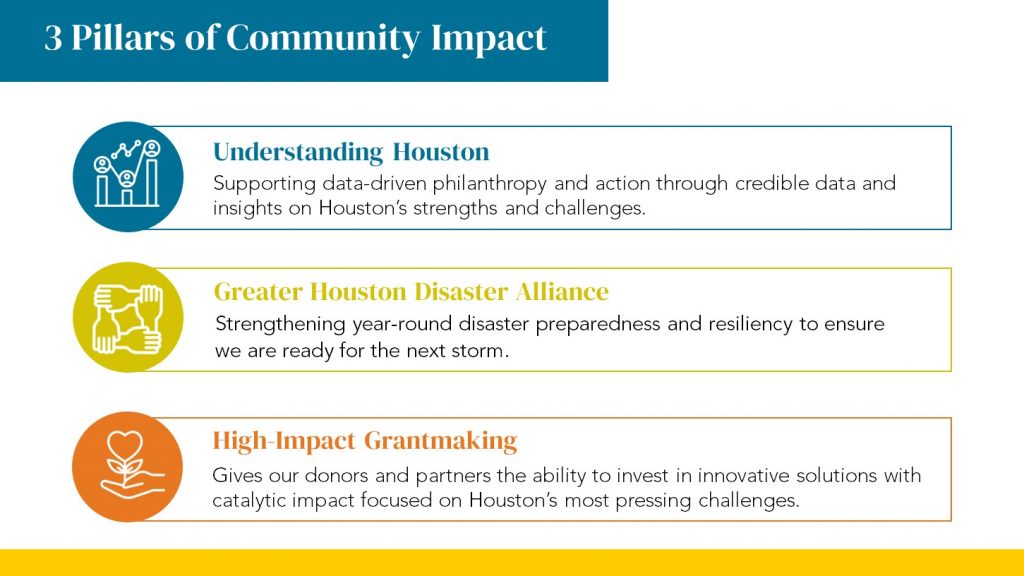
Understanding Houston is a collaborative initiative led by Greater Houston Community Foundation to empower us all with the information we need to build a Houston region that provides everyone the opportunity to reach their full potential.
Watch the Recording: In the Spring of 2026,Greater Houston Community Foundation’s hosted a webinar with Sherri Chisholm, Executive Director, and AJ Calhoun, Managing Director, at Leading on Opportunity to learn more about how LOO uses data, strategy, and policy to move the needle on economic mobility in Charlotte, North Carolina; and the strategies and lessons learned along the way.
Join an Upcoming Webinar: The Community Foundation invites you to join our Economic Mobility Learning Series, which are virtual presentations and discussions on models that advance economic mobility, featuring proven and emerging approaches from across the nation. Each webinar will explore real-world cross-sector efforts and research that help individuals and families move up the economic ladder. Sign up for the next webinar!
Share Your Feedback: If you’re interested in getting involved, sharing your data story, learning more, or giving us some feedback, click here.