
Neighborhoods matter. Where we live has a profound impact on our lives in ways we don’t always understand.
Maps and dashboards that provide quality-of-life data at the neighborhood-level are a key piece to the puzzle of understanding communities. Understanding Houston focuses on county-level data to measure how the region performs overall and across time, but we know that place matters when it comes to moving the needle for the whole region. That’s why we have curated a list of special tools that help you understand Houston’s neighborhoods a little better.
Houston Community Data Connections (HCDC) from Rice University’s Kinder Institute for Urban Research
The tool
HCDC launched in 2017 to arm community leaders with data to inform planning and decision-making. The site contains a robust online dashboard that provides neighborhood-level indicators for Harris County and a research gallery of interactive data stories on a variety of topics related to demographics, housing, poverty/income and more. The dashboard allows users to overlay various indicators on a map, view detailed community profiles, and compare neighborhoods to one another and over time.
Why we love it
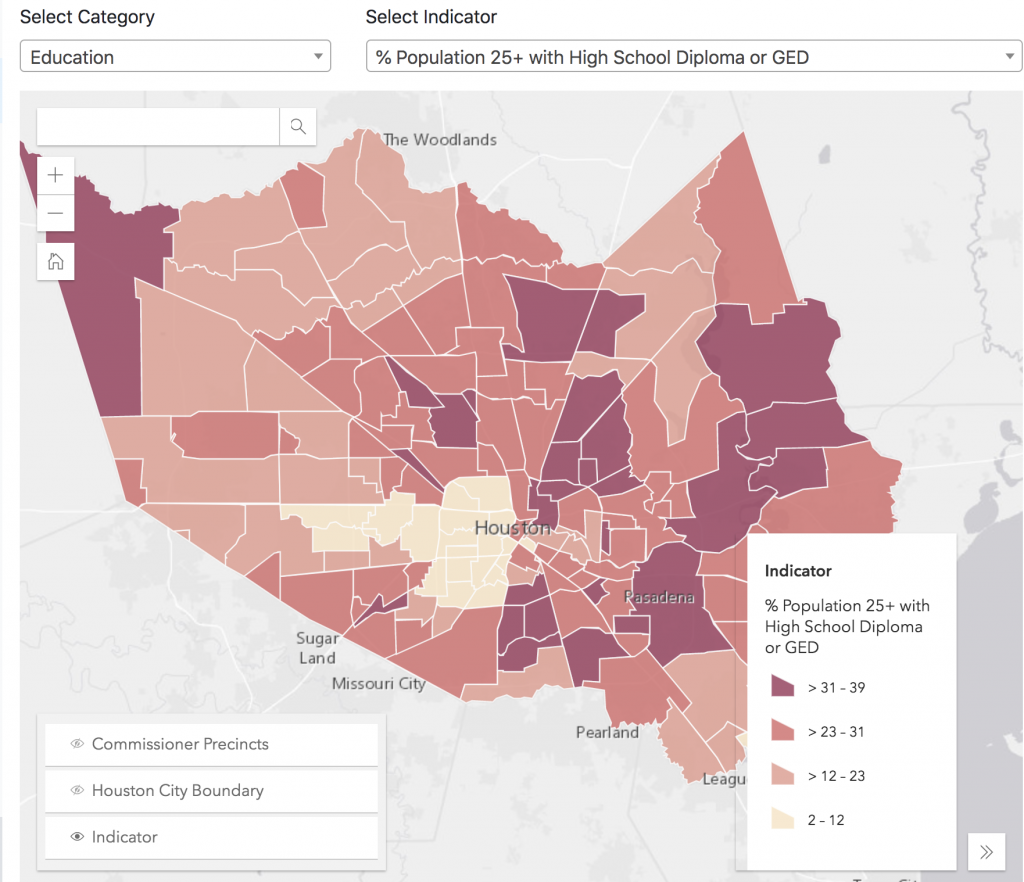
This tool is excellent if you want to create maps to include in your presentations and want a quick profile of a particular neighborhood. We also love how the interactive data stories present a variety of data in context with analysis on fascinating topics. Be sure to view the FAQs and training guide before beginning to get the most from this tool.
Opportunity 360 from Enterprise Community Partners
The tool
Opportunity360 Community Dashboard offers a comprehensive view of any neighborhood in the country by measuring five foundational criteria shown to have the greatest impact on how we live: housing stability, education, health and well-being, mobility, and economic security.
Why we love it
The Opportunity360 Community Dashboard offers more than 150 indicators from 27 sources and can compare up to three census tracts at one time. Users request dashboards by entering a location or address and then receive the dashboard via email. The interactive dashboard allows users to export data, filter visuals, print, and hyperlink to specific sections. Be sure to check out Opportunity360’s list of resources, FAQs, and methods. Opportunity360 also offers additional tools, resources, and reports on how other organizations used the data to inform their decision-making and planning, so be sure to explore the website.
Opportunity Atlas, a collaboration among researchers at the Census Bureau, Harvard University, and Brown University
The tool
Opportunity Atlas is an interactive tool that measures the extent to which groups move up (or down) the economic ladder by looking at various outcomes of adults and back-mapping where they grew up. Users can select which adult outcomes they want to explore (e.g., household income) for a demographic group (e.g., low-income Asian women) by various neighborhood characteristics (e.g., poverty rate).
Why we love it
The census tract-level data reveal insights about communities most likely to produce adults with promising or poor outcomes. The mapping feature allows you to see how neighborhoods in close proximity can produce adults with vastly dissimilar outcomes, or how different groups in the same neighborhood have contrasting outcomes.
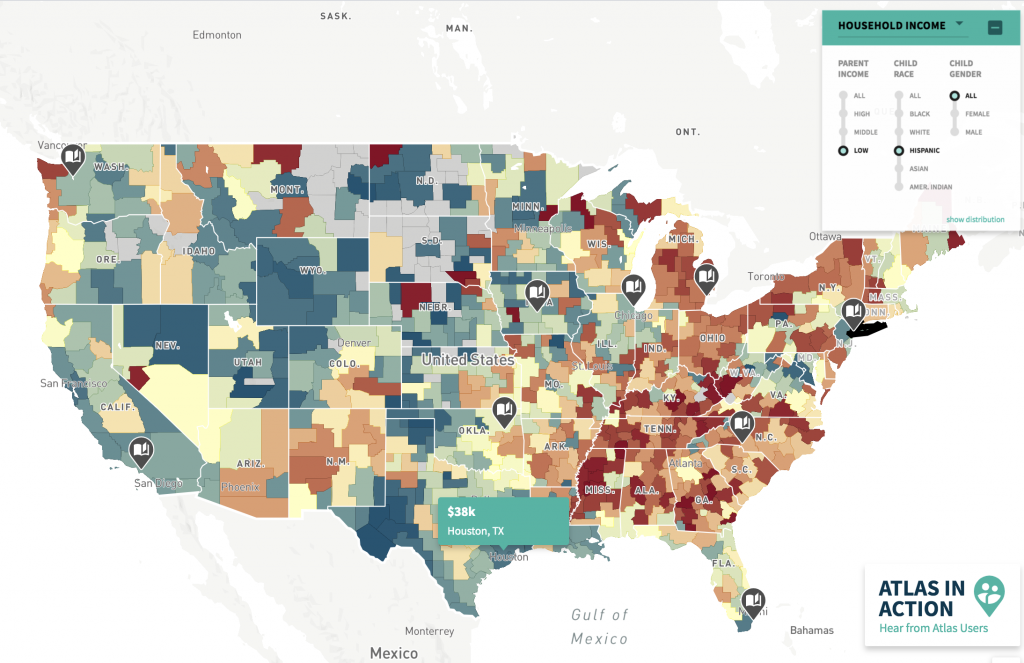
Use interactive maps to explore outcomes in health, education, income and more by census tract.
You can download maps as images to include in presentations, download the data itself, and overlay your own data onto the map. Don’t forget to explore interactive stories on the site that are not only insightful, but also give you ideas on how to begin. And, as always, familiarize yourself with the user guide, methods, and FAQs before you begin.
Child Opportunity Index from Diversity Data Kids
The tool
The Child Opportunity Index (COI) measures and maps the quality of resources and conditions that matter for children to develop in a healthy way. It combines data from 29 neighborhood-level indicators into a single composite measure.
Why we love it
Users select a metropolitan area to view census tracts. You can also see where children of different racial/ethnic groups live, compare metro areas, download datasets, and view data stories for greater insights. If you have questions after reading the report, reviewing the technical document, and looking over the FAQs, be sure to contact them.
Houston-Galveston Area Council
The tool
Houston-Galveston Area Council (H-GAC) is a regional organization through which local governments consider issues and collaborate to solve region-wide problems. H-GAC provides extensive research and data to the public through online visual and mapping tools to inform local and regional planning, programming, policy-making, and decision-making.
Why we love it
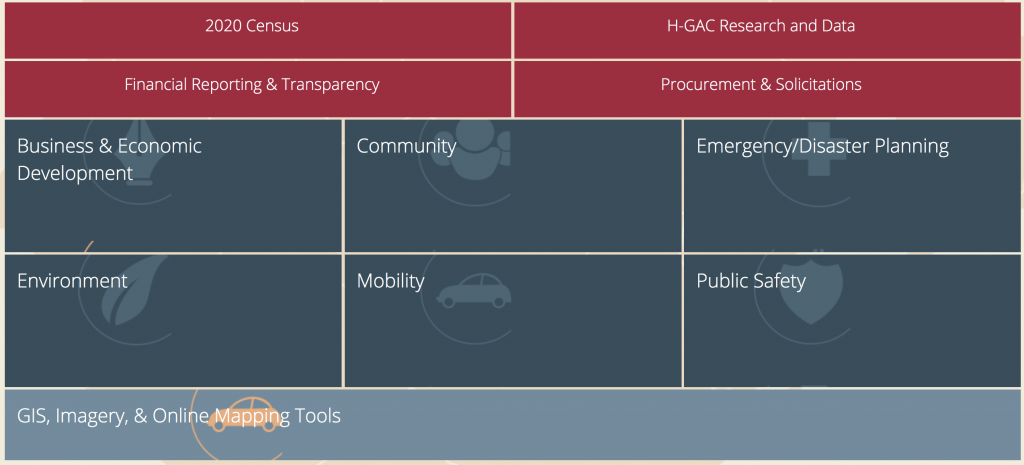
There is a ton of information here. Depending on availability, data are provided at various geographic levels, including census tracts. Find data and analysis on several topics ranging from employment, environment, land use/planning, transportation including commuting flows and mobility, and population.
Data.census.gov from the Census Bureau
The tool
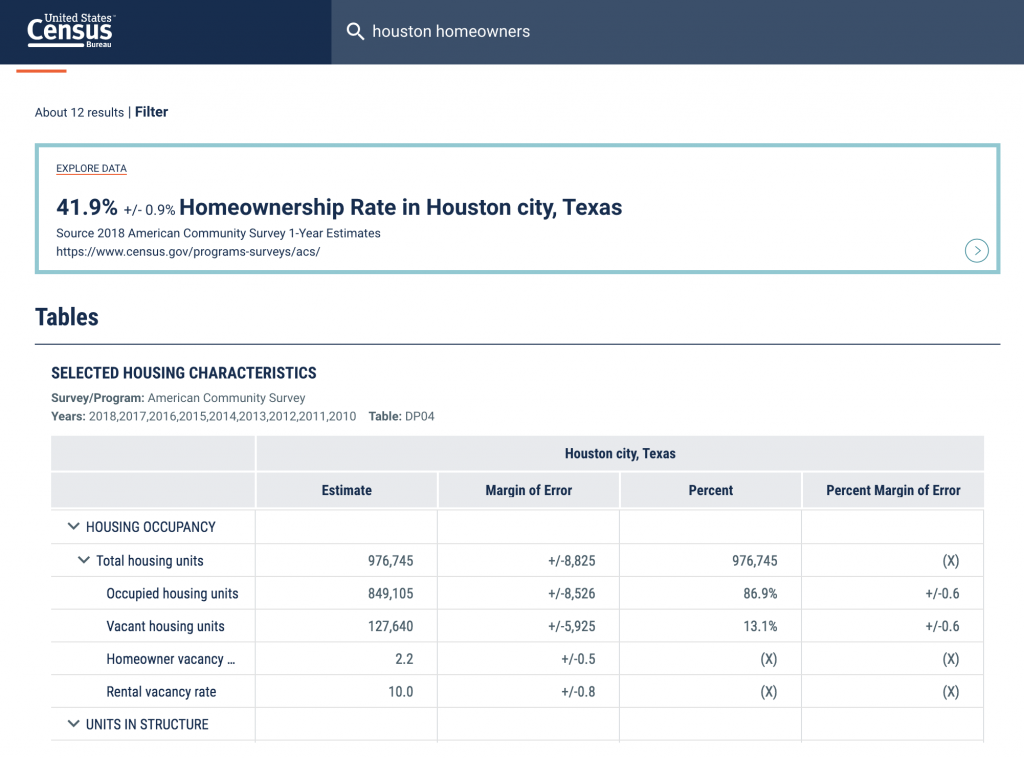
The Census Bureau is the nation’s leading provider of quality data about its people and economy. The best way to access data collected and prepared by the Census Bureau is through data.census.gov, the Bureau’s new data platform designed for all users – not just researchers. The Census Bureau conducts the decennial census, economic census, demographic surveys, economic surveys, housing surveys, provides population estimates and counts, and produces original research.
Why we love it
You can access demographic data at the zip code, census block, block group, and tract level. Users are able to create maps and manipulate data tables for efficiency. The Census Bureau has provided several resources to help users learn this new platform and hone data skills with their Census Academy. Learning tools include data gem videos, online courses, previously-recorded webinars and upcoming webinars.
Location Efficiency Tools from the Center for Neighborhood Technology
The tool
Location Efficiency Tools are a suite of web-based tools, comparison maps, downloadable data, research reports, and more that can help communities become more convenient and livable. The Center for Neighborhood Technology (CNT) works to improve cities’ economic and environmental sustainability, resilience, and quality of life.
Why we love it
The Housing and Transportation (H+T) Affordability Index, one of the tools, provides a comprehensive view of affordability that includes both the cost of housing and the cost of transportation at the neighborhood level. The website contains four tools (H+T Index map, H+T Fact Sheets, Total Driving Costs tool, and Comparison Maps). There’s a lot of info here too, so be sure to check out the about section to learn more about the data available, read the user guide, and find FAQs.
Making a difference starts with the right information
Whether you’re conducting research for a new proposal or looking for data that can help you better direct your own community efforts, using the right tools to find the best information is always a good first step. And, Understanding Houston is a great place to start. Featuring over 200 indicators on key quality of life issues, Understanding Houston aggregates and analyzes county-level data over time with state and national comparisons.
We also share new research and analysis that is important to Greater Houston now. From the ongoing effects of COVID-19 to disparities in life expectancies throughout Greater Houston, we’re measuring the things that matter to help Houstonians do what matters. Join us and stay in the conversation by getting involved, following us on social media or signing up for our newsletter.