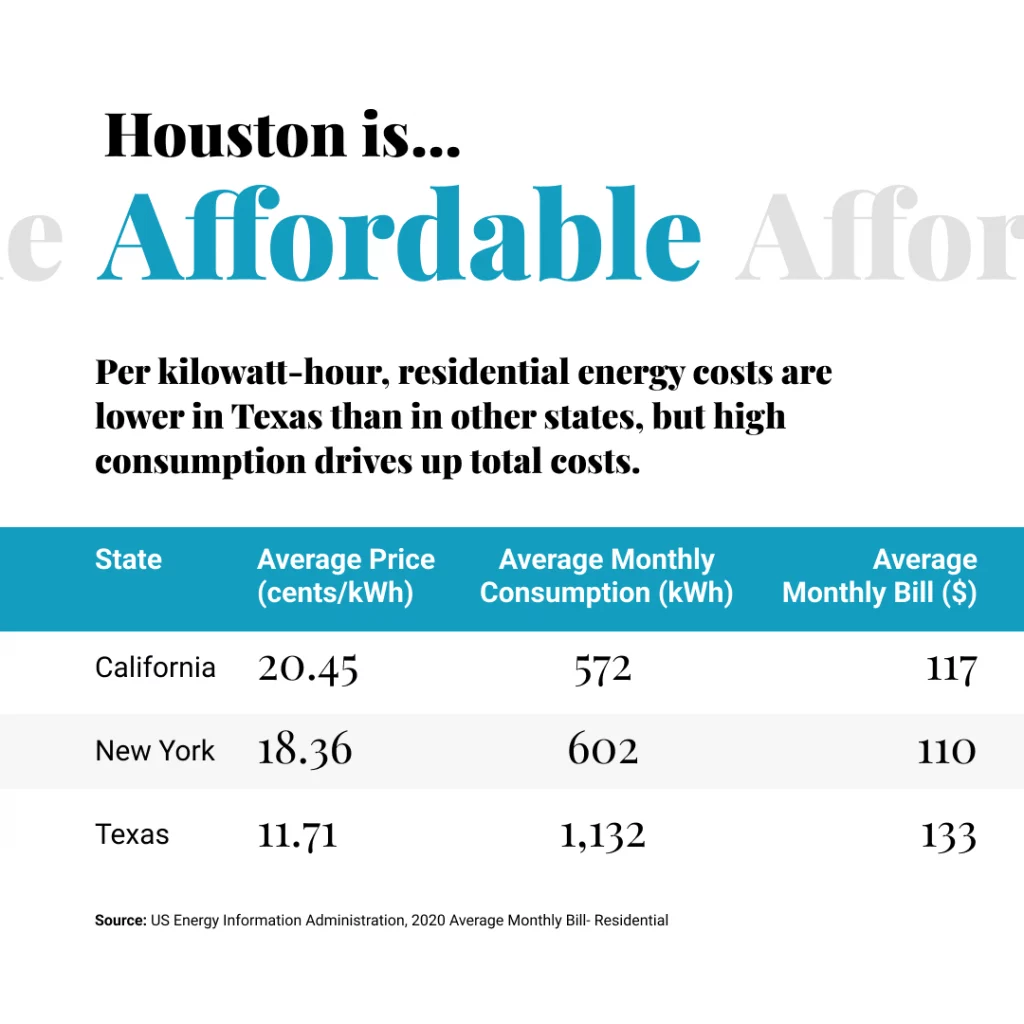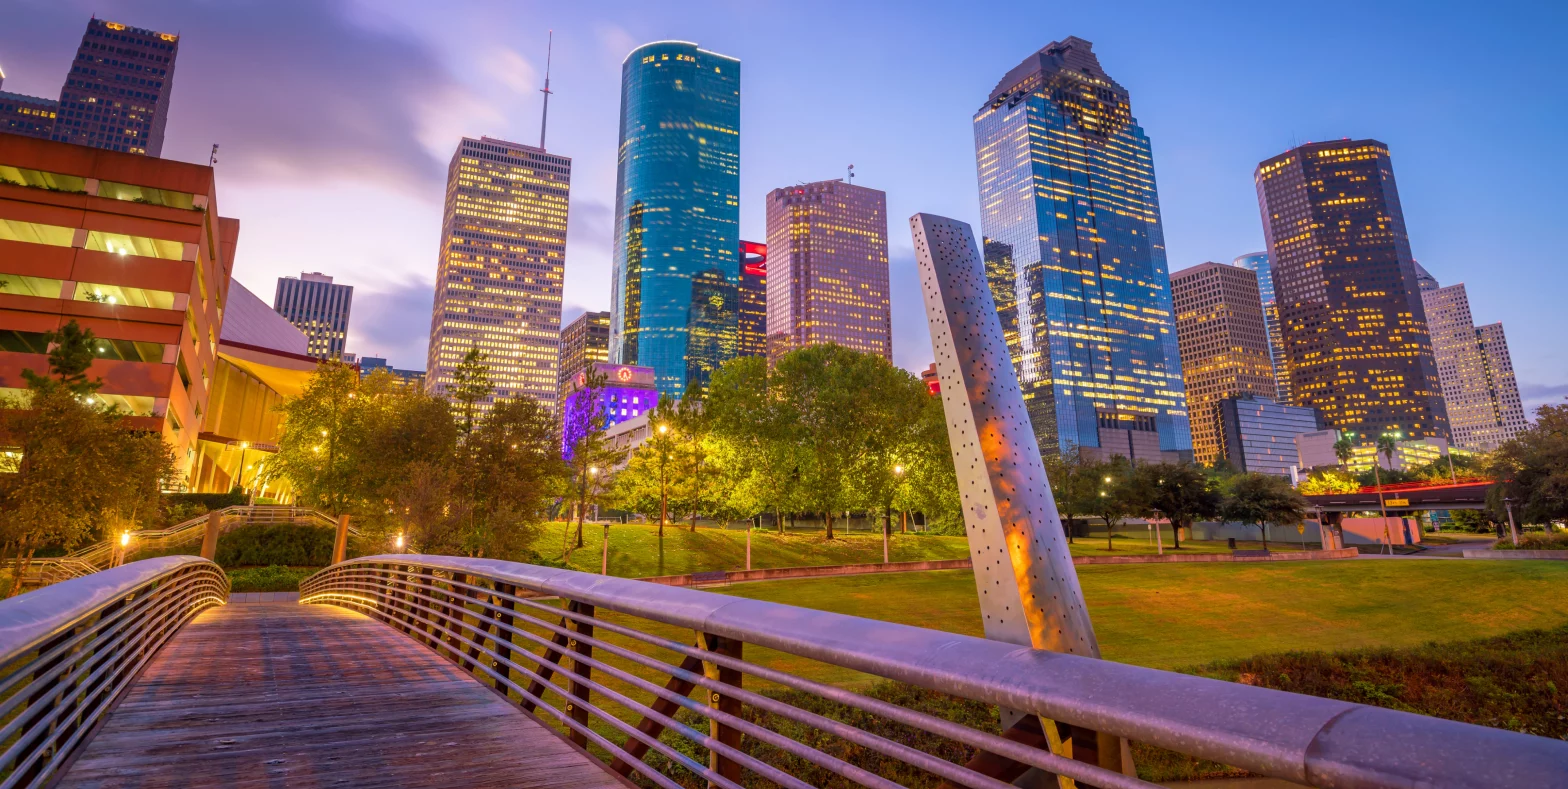
Houston is big. The region’s size and all it encompasses has become an in-joke among residents — “Houston is an hour away from Houston,” the old saying goes. The city is sprawling, populous, industrial and growing. The reasons for the sprawl, rapid population growth and the breadth of successful industries are many and complex. We know that Houston is the 4th largest city in the U.S., but in what ways is Houston big other than in size and population? And how does Houston’s size affect its residents directly and indirectly?
Qualifying Houston’s “big-ness”
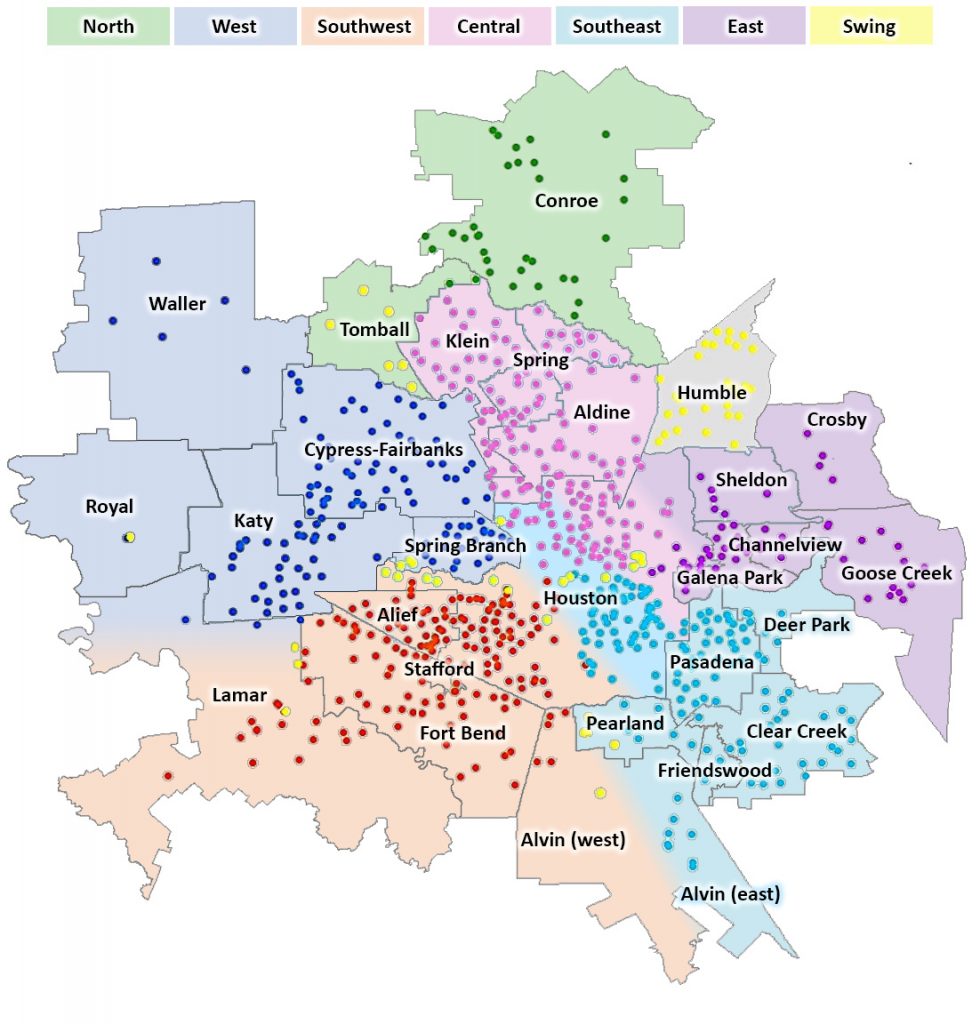
Understanding Houston provides data on Houston’s three-county region, but looking at the nine-county Houston-The Woodlands-Sugar Land Metropolitan Statistical Area (MSA) — all of which many people consider “Houston” — can put into perspective the aggregate size of Houston and all of its satellite cities.
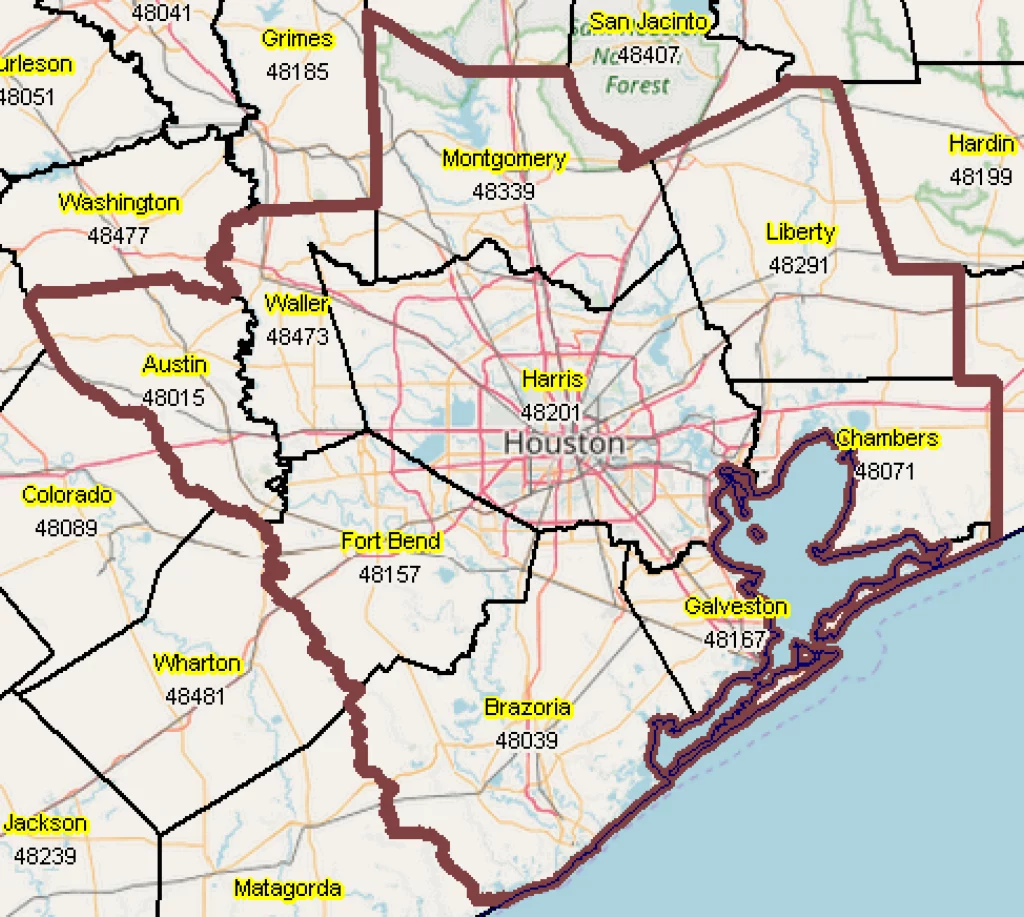
An MSA is the formal definition of a region linked by social and economic factors — the region where we live and work. The Houston MSA includes Austin, Brazoria, Chambers, Fort Bend, Galveston, Harris, Liberty, Montgomery and Waller counties — an area that spans 9,444 square miles and is larger than the states of Connecticut, Delaware, New Hampshire, New Jersey and Rhode Island. Moreover, more than 100 cities and 40 unincorporated towns are within the Houston MSA boundaries, including Baytown, Fulshear, La Porte and Prairie View. If the Houston MSA were its own state, it would have the 15th largest population in the United States, with 7.2 million residents.
Even if one were to only consider Harris County, they would still be dealing with an area larger than many other “big” U.S. cities — its 1,778 square miles are enough to fit the cities of Austin, Boston, Chicago, Dallas, New York City and Seattle and still have room to spare.
Sprawl contributes to longer-than-average commute times, food deserts
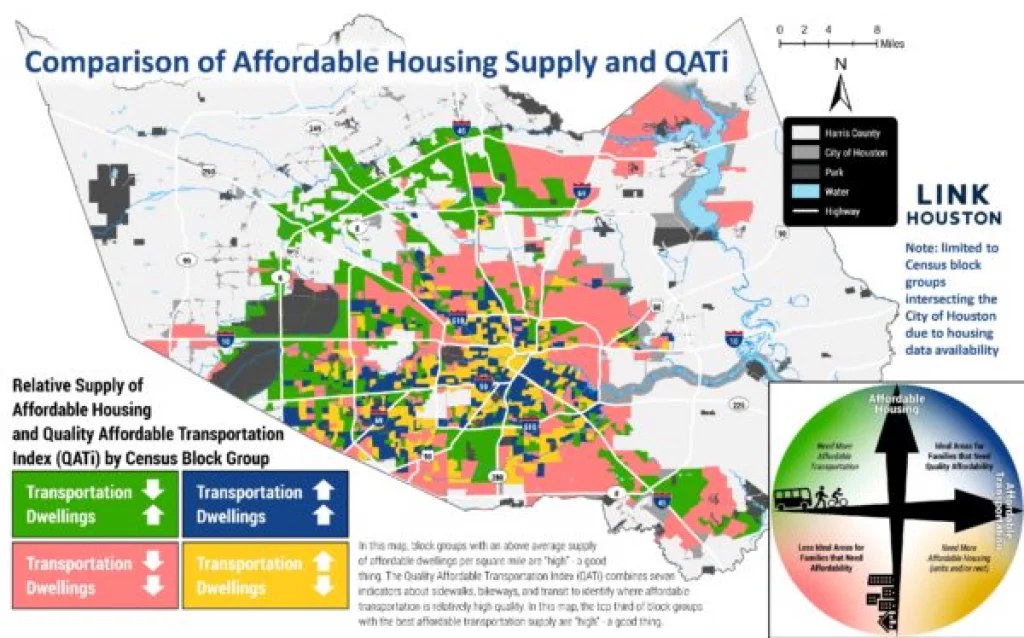
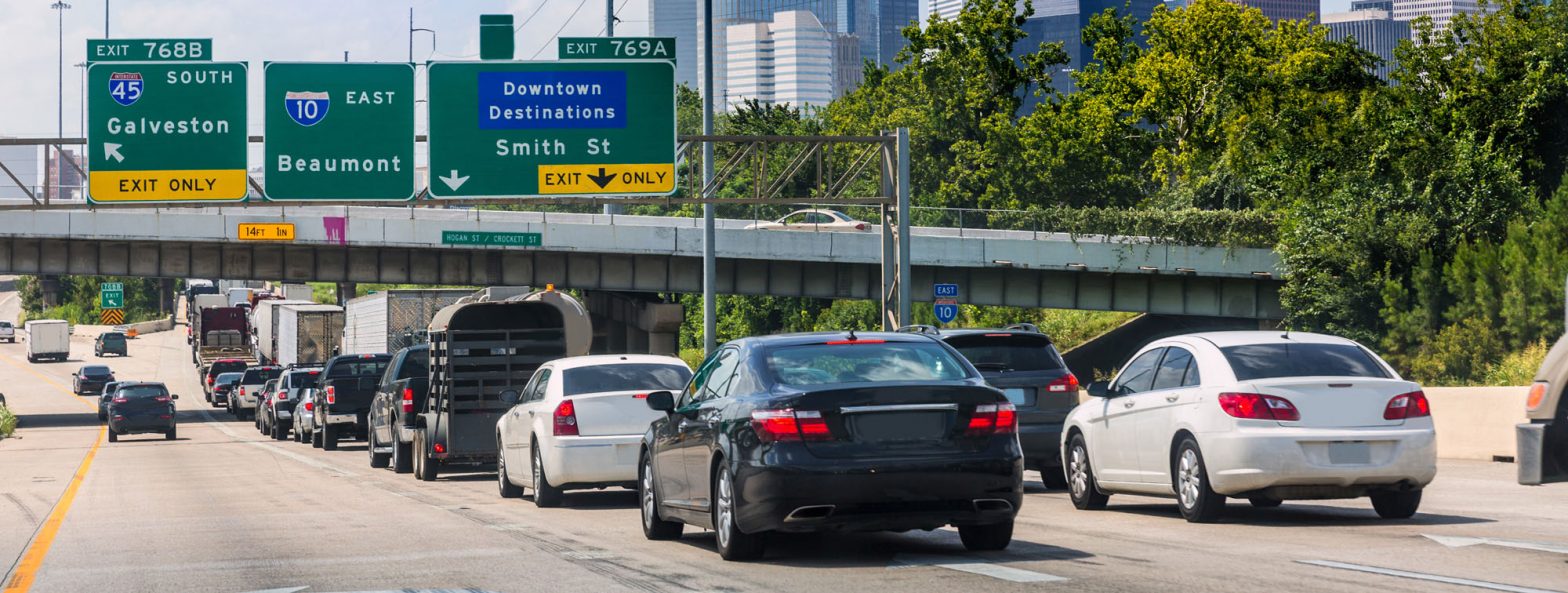
The old joke about Houston being an hour away from Houston largely stems from our many suburbs. Houston’s suburban communities offer many benefits for residents, including access to more affordable housing. However, the prominence of far-flung communities also carries consequences, including longer-than-average commute times and reduced investment in urban centers.
Commute times are a big challenge throughout Greater Houston. Many Houstonians face complications from urban traffic and congestion, construction, long distances and lack of public transport outside of the 610 Loop — sometimes all of the above.
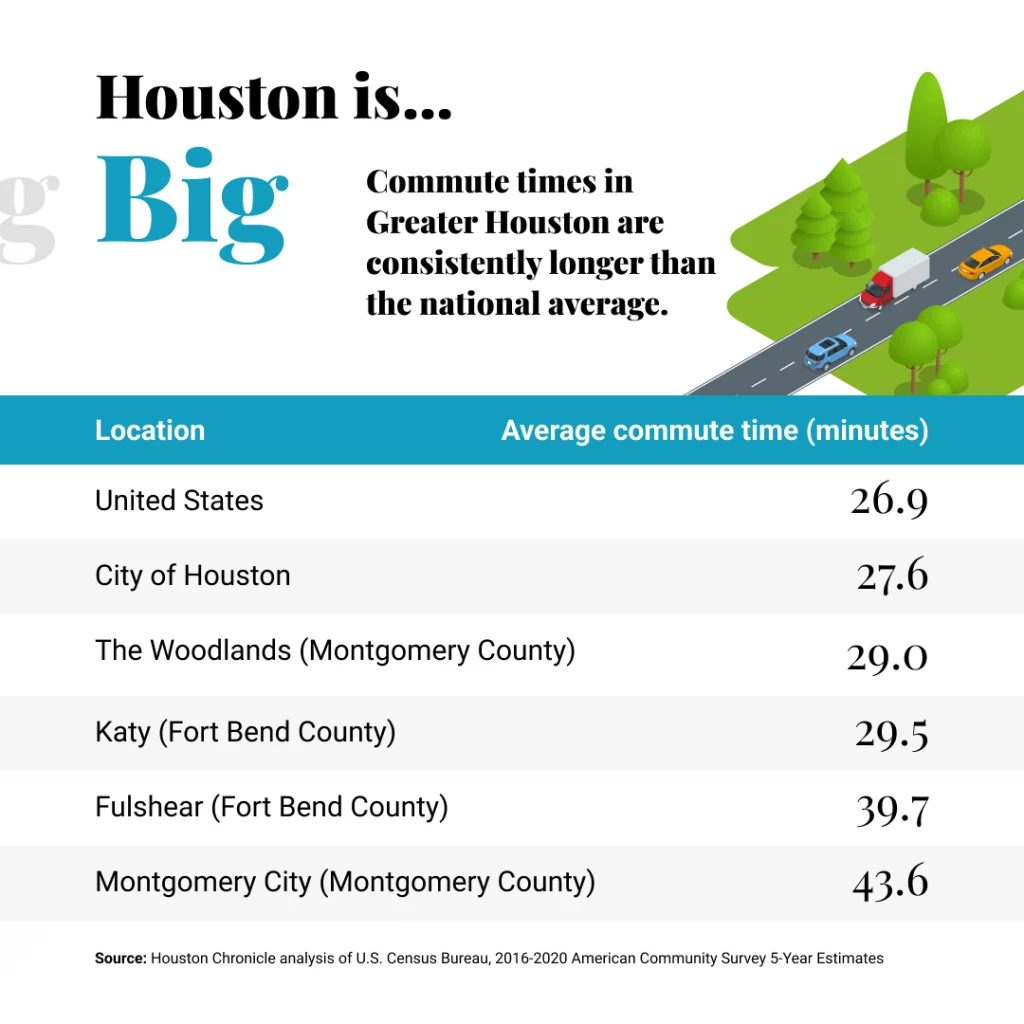
Another reason Houston has long commute times is that we are less likely to carpool to work than the average American. Nearly 79% of workers in Houston’s three-county region commuted alone in 2017 compared to the national average of 76%, which helps explain why Houston’s commute times are still higher than the state and national average.
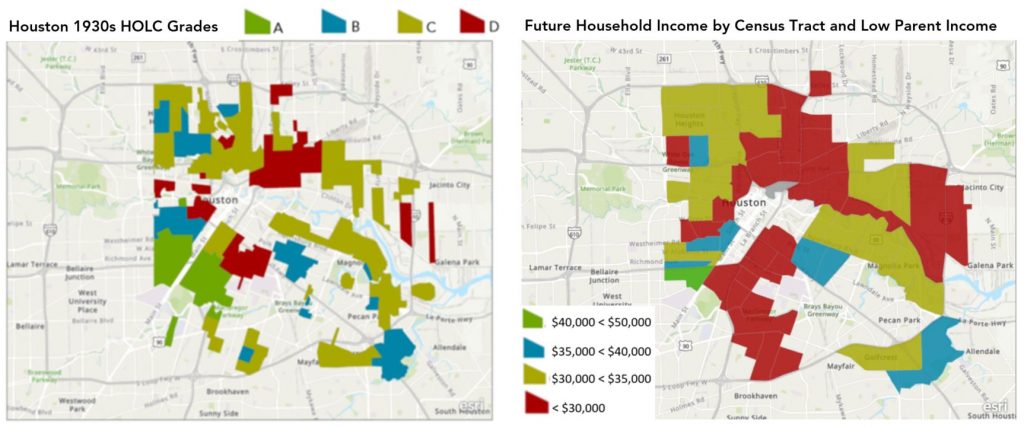
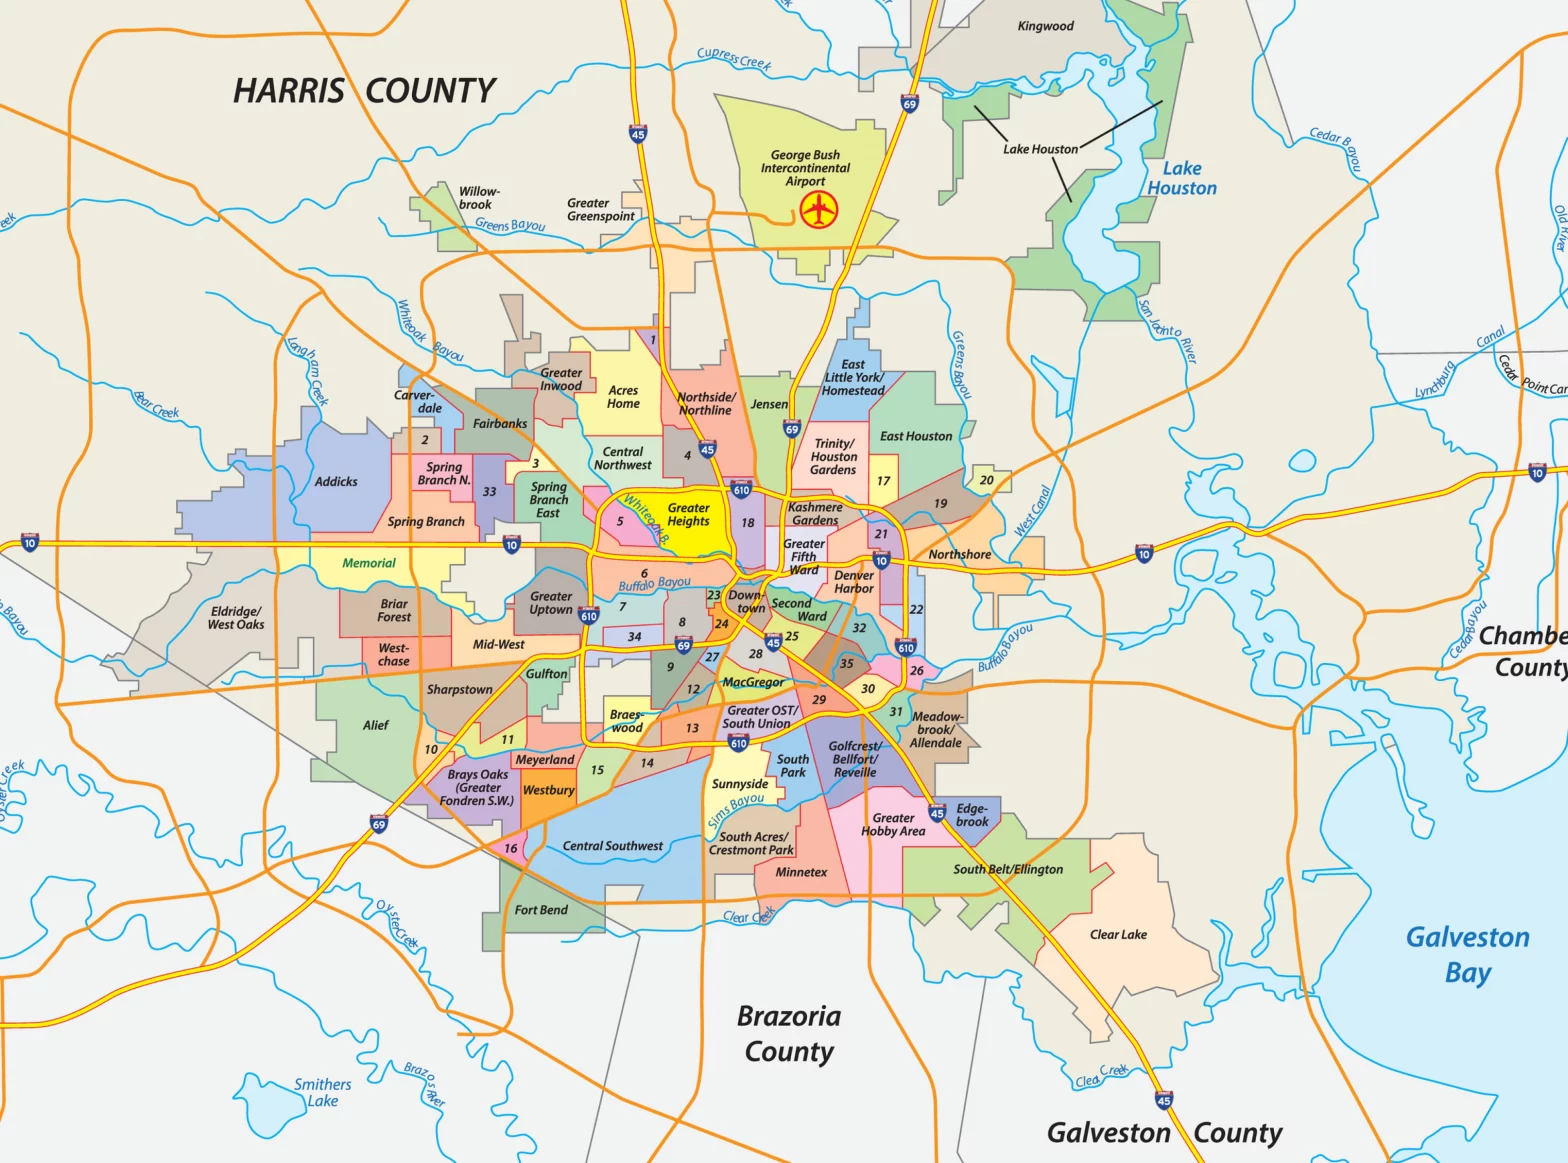
The emphasis on suburban sprawl can also contribute to the formation of food deserts in some of Houston’s urban areas. Food deserts are areas in which residents have a difficult time finding fresh and affordable food, like fruits and vegetables, due to a lack of grocery stores or a lack of affordable transportation to reach grocery stores with any regularity. Some Houston-area food deserts include Fifth Ward, Third Ward, Sunnyside and Acres Homes. Residents of food deserts without access to reliable and affordable transportation may resort to purchasing their food at nearby gas stations, dollar stores and fast food chains, which can result in higher rates of obesity, heart disease and diabetes.
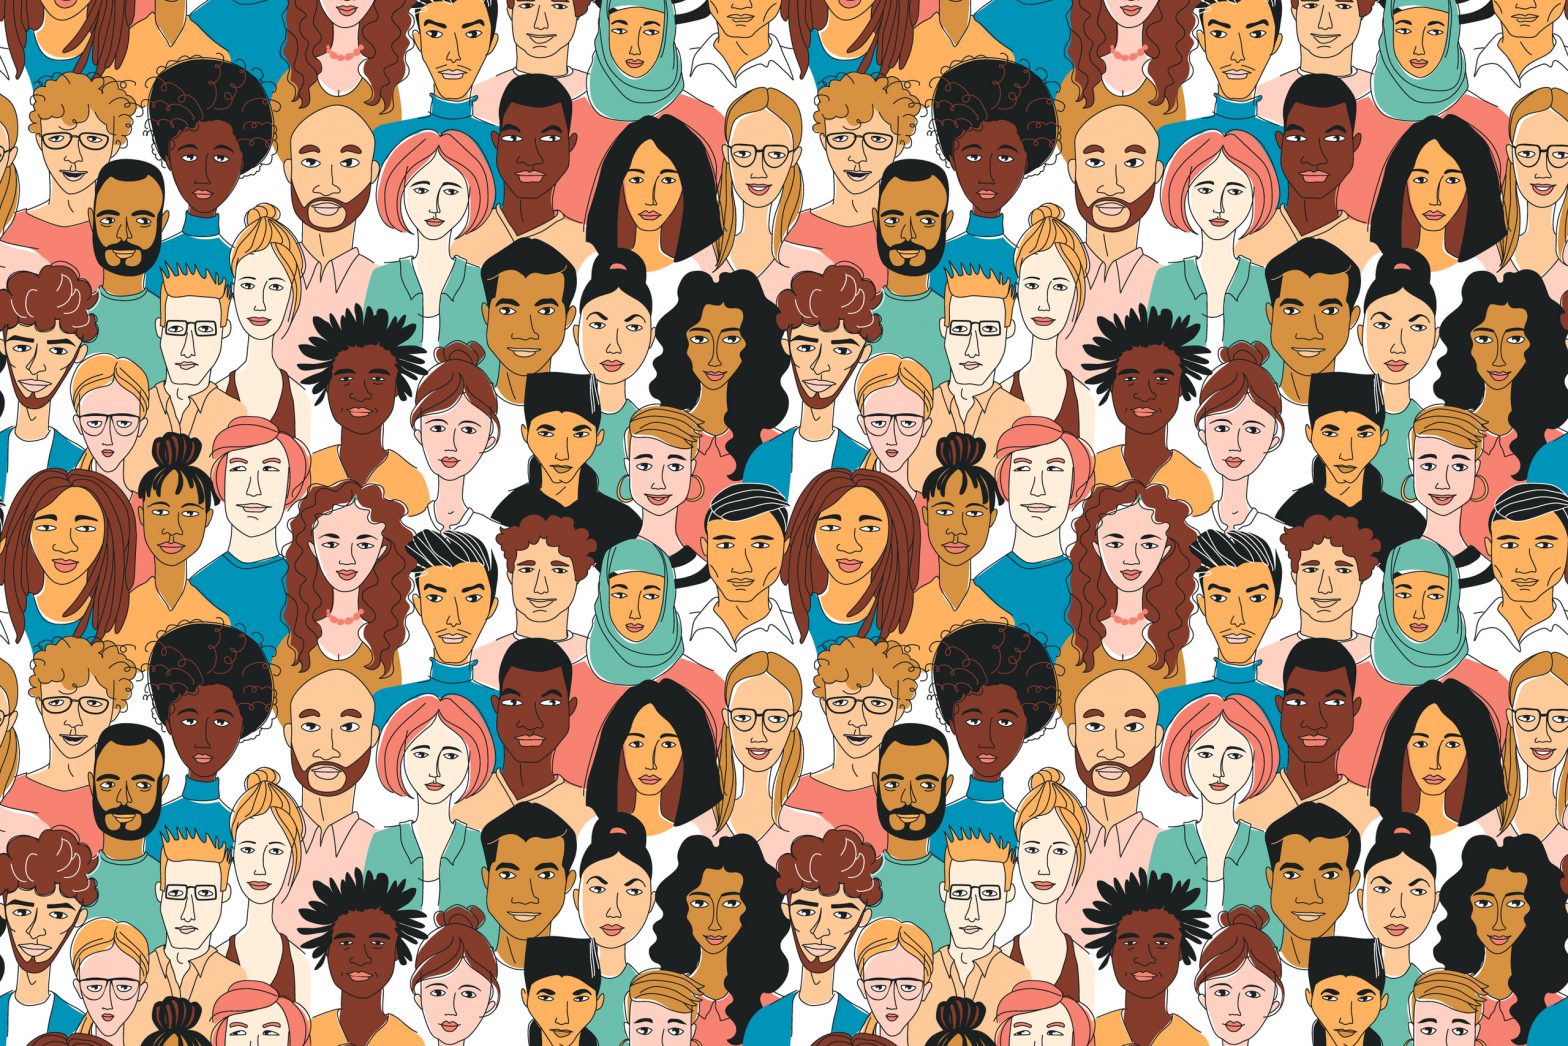
Greater Houston’s large and diverse population
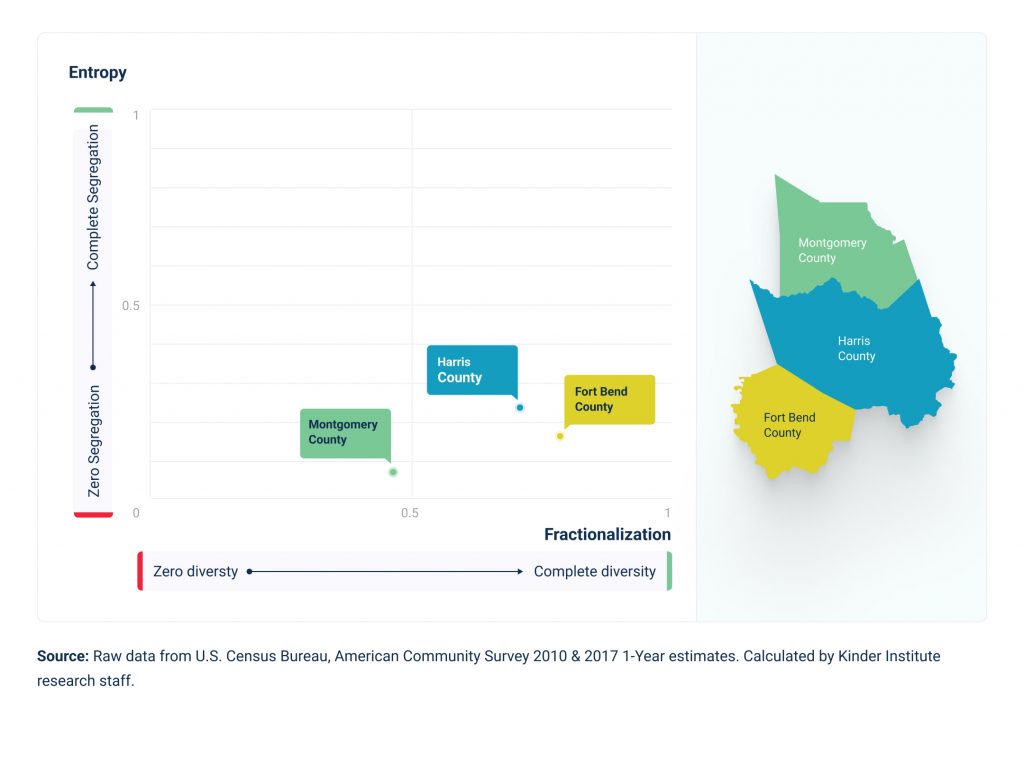
It is a well-known fact that diversity is big in Houston. The city, which years ago was reported to be the most diverse place in America, is what many researchers believe to be an ethnographic snapshot of the future of America. More than two-thirds of the region comprise individuals from nondominant groups, who accounted for 95% of Texas’s population growth over the last decade.
Hispanics/Latinos constitute the largest ethnic group in the region. Close to 2.4 million Hispanic residents accounted for nearly 39% of the region’s population in 2020, with 2 million of those residents representing Harris County alone. Among the 100 most populous counties in the nation, only 12 had higher percentages of Hispanic residents than Harris County. And our region’s Latino population continues to grow – increasing by 26% in the region between 2010 and 2020.
The three-county area is home to nearly half a million Asian Americans, with the largest two groups being Indian Americans (145,000 in 2020) and Vietnamese Americans (141,400 in 2020). These communities are big not just in the number of residents, but also in cultural and economic import. The Mahatma Gandhi District and Little Saigon are two economic and cultural hubs in which the city’s rich cultural heritage is preserved through community initiatives, small businesses and food.
Growing income gaps
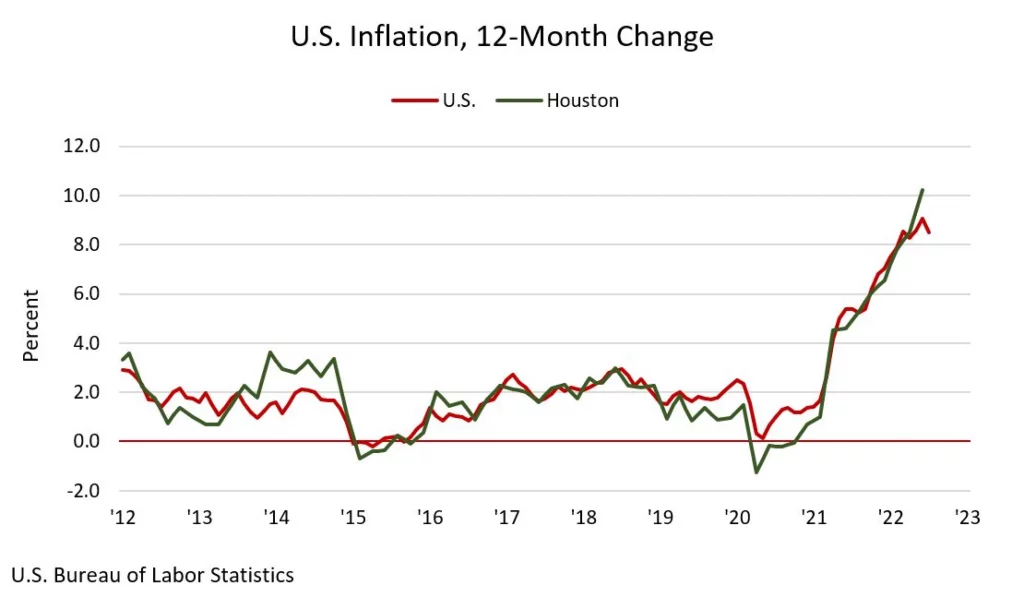
Although Greater Houston’s diversity is often touted as a strength, quality of life in the region is not always equal. Income inequality is also big in Houston. Although counter-intuitive, an increase in average wealth over the last five decades has led to an increase in income inequality. American families in the top 90th percentile have seen their wealth increase five-fold, while the bottom 10% of earners have gone from having no accumulated wealth to being about $1,000 in debt.
Income inequality has also increased in the Houston region, where pay gaps are also significant — and some growing — along gender and ethnic/racial lines. Median earnings between different groups are one way to measure pay gaps. Across both the U.S. and Texas in 2017, full-time, year-round male workers made about $10,000 more per year than their female counterparts. While the pay gap in Harris County (at about $7,500) is smaller than in the state and nation, it is significantly larger in Fort Bend and Montgomery Counties, with women earning $15,137 and $20,555 less, respectively.
The pay gap between Black and white workers has widened since the 1970s in the U.S. Black workers are the only racial group to experience declining median earnings nationally between 2010 and 2017. The Black-white pay gap has remained flat in Texas and grown worse in Montgomery County. The largest racial/ethnic pay gap in Texas is among Hispanic workers, who earned just 60 cents for every dollar a white worker made in 2017.
Big institutions
Physical size aside, Greater Houston has several large institutions that shape life throughout the region. In addition to our beloved food and music cultures, Houston is recognized globally for its expansive arts community and its world-renowned medical center.
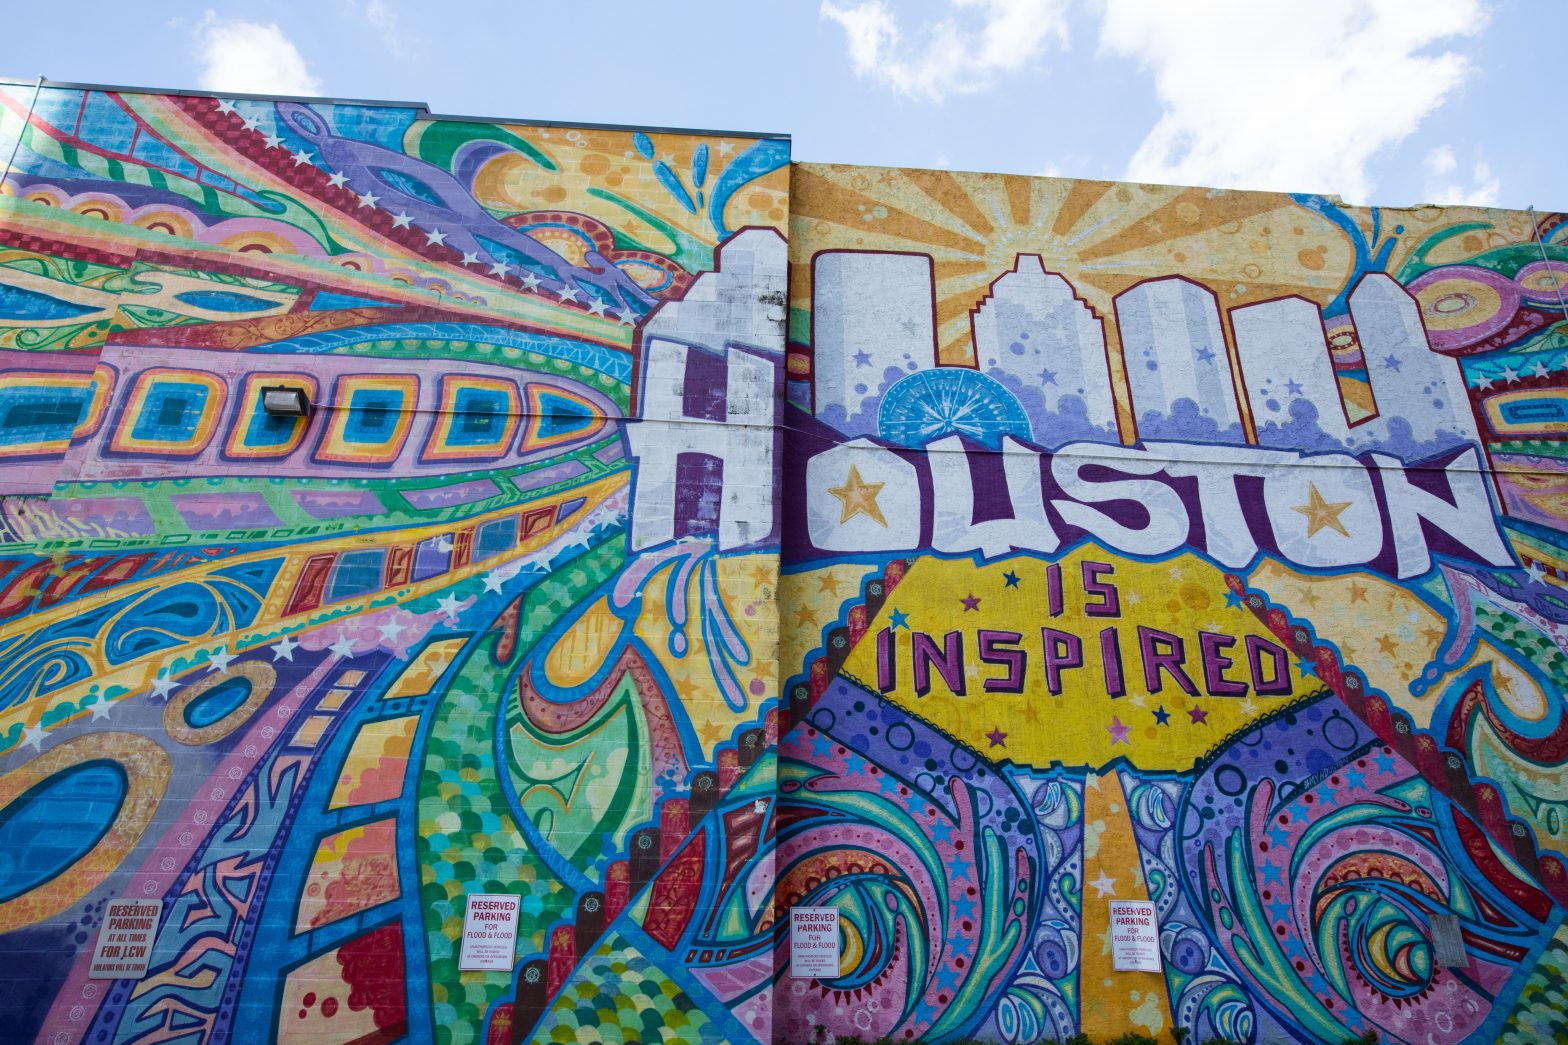
Greater Houston’s art scene is a staple of the region. Stretching from the echoing halls of major institutions in the Museum and Theater District, to the neighborhood murals and the many festivals and installations. Houston has over 550 nonprofit institutions devoted to the arts and sciences that support the equivalent of 25,817 full-time jobs and generated over $1.1 billion in total economic activity in 2017. Understanding Houston has previously discussed the prolific Houston Theater District spanning 17 city blocks, and the 19 world-class museums available in Houston’s Museum District.
Houston is also known for the Texas Medical Center, the world’s largest healthcare complex and life sciences destination. In the Med Center are M.D. Anderson Cancer Center, the number one cancer center in the U.S., as well as Texas Children’s Hospital, the second-ranked children’s hospital in the country.
Big challenges, big opportunities
Houston is big, but we are still one community despite our size. Making the most of the qualities that help Houston thrive requires thinking with the big picture in mind. Lack of public transit near Fulshear contributes to longer commutes near Downtown. Pay gaps between workers in Greenway impact small business health in Humble. We may call different counties home, but at the end of the day, we are all Houstonians, and what matters to some of us ultimately matters to all of us.