Category: Topic

For the 8 Indicators/Topics pages only

  • Access to the Arts

    Access to the Arts

    Access to the Arts in Houston 

    Spending on arts and culture is increasing in our region, but not at a pace consistent with our growing population

    While access to and interest in art and cultural organizations is generally increasing, the three-county area still lags behind the nation in overall support. 

    As of August 2021, the data on this page will no longer be updated. While the content remains accessible for reference, please note that it does not reflect the most current information. If you’d like to explore the most up-to-data data available, please refer to:

    Why access to arts matters to Houston

    A strong artistic community is vital to the ongoing success of our region, and its importance goes far beyond entertainment — that is, if it’s accessible. Why is access to art important? Access to the arts promotes inclusion, community improvements, academic achievement and even improved mental health for residents.2,3 And in order for creativity to work positively in Houston, artistic professionals must be able to access the organizations that enable their work.

    By exploring the data and staying informed on art accessibility, Houstonians can do more to keep these valuable resources available where they’re needed most.

    The data

    Measuring arts and cultural organizations in Houston

    What does access to the arts mean? One way to measure access to the arts in Houston is to measure the number of arts and cultural organizations operating in the three-county region. More arts and cultural organizations mean more art in our communities and more opportunities for artists with different skill sets and backgrounds to contribute to our cultural landscape. And over the past 25 years, these nonprofit organizations have enjoyed consistent growth throughout the three-county area. 

    As of 2015, there were 602 nonprofit arts and cultural organizations across Fort Bend, Harris and Montgomery counties, up from just 181 in 1990. In Fort Bend County, nonprofit arts and cultural organizations have grown sevenfold from six in 1990 to 49 in 2015. Both Harris and Montgomery counties also saw significant growth in their arts and culture sectors. Harris County gained 358 organizations, and the number of arts and cultural institutions in Montgomery County more than tripled. 

    Arts and cultural organizations per 100,000 residents

    Perhaps unsurprisingly, Harris County is home to the vast majority of our region’s artistic and cultural resources. However, Fort Bend and Montgomery County are also experiencing some growth relative to the size of their populations. 

    When compared to similarly-sized communities throughout the country, all three counties fall near the middle of the pack or lag behind. While Harris County experienced the largest total growth in arts and cultural organizations per 100,000 residents between 1990 and 2015, all counties have seen growth during the time period.

    “When compared to the overall rate of population growth in Fort Bend and Montgomery counties, the growth of artistic organizations is still relatively small.”

    Art providers in the Houston area

    Another way to measure art access in Greater Houston is through the Arts Vibrancy Index. Created by our partners at SMU DataArts, the Arts Vibrancy Index measures key indicators of artistic health in a region on a scale from 0 to 100. The Arts Vibrancy Index scores are akin to percentiles, meaning that if an area shows a score of 52, it outperforms 52% of other similar areas (in this case, counties) on that measure.*  

    The art providers score is part of the Arts Vibrancy Index and evaluates the overall presence of art in a given area as indicated by the number of artistic organizations and practitioners per capita. These components are combined in an overall score ranging from 0 to 100. 

    Although arts, culture and entertainment firms are well represented across the three-county area, our overall arts providers scores place us near the middle or the bottom of the pack. Notably, Montgomery County has both the highest score for independent artists (36) and the lowest score for arts and culture organizations (24) in the area. 

    Cultural and ethnic awareness organizations in the Houston area

    Houston is one of the most ethnically and culturally diverse cities in the country. And as our diversity continues to increase, cultural organizations that reflect the contributions and traditions of our multi-ethnic population are becoming increasingly important. 

    Consistent with our growing diversity, the numbers of cultural and ethnic organizations have skyrocketed in the three-county area, with Harris County contributing the lion’s share of growth. In 1990, only six cultural and ethnic organizations existed and all of them were in Harris County. As of 2015, Fort Bend, Harris and Montgomery County have all seen growth in this vital category, with Harris County jumping from six to 87, and Fort Bend County jumping from zero to eight. Although these numbers may seem low, growth in this area suggests that the nonprofit arts sector is aware of the cultural needs of our region’s diverse populations and is taking meaningful steps toward serving and engaging them. 

    Sixteen-fold increase in cultural and ethnic awareness organizations

    Consistent with our region’s growing diversity, the number of artistic organizations dedicated to cultural and ethnic awareness skyrocketed between 1990 and 2015.

    Measuring spending by arts and cultural organizations

    Houston’s art and cultural sector plays a crucial role in our overall economic prosperity, and examining how creative organizations use their resources in our communities helps us understand their larger role in the Greater Houston economy. Per the Arts Vibrancy Index, this spending indicates how much money the region uses on arts and cultural programming, helping to gauge the overall demand for arts and culture offerings in Houston. 

    Between 2000 and 2015, total spending by arts and cultural organizations in the three-county area more than doubled, jumping from $267 million to $563 million. The vast majority ($514.4 million) of the spending in 2015 occurred in Harris County. Fort Bend County’s spending increased by 32% over the 15-year period, moving from $4.8 million to $6.4 million; and Montgomery County’s arts and cultural spending also saw a twofold increase, rising from about $21 million to nearly $42 million. 

    However, these increases are much more modest when weighed against overall population growth. Between 2000 and 2015, Fort Bend County’s per capita arts and cultural spending actually decreased by 35%, suggesting that Fort Bend’s population growth over that time outpaced the growth of arts spending in the region. 

    What we spend on art and culture

    The Arts Vibrancy Index also tells us how much money is spent on the arts, including state and federal funding for Texas art grants.. Scores range from 0 to 100 and are comparative based on other areas of similar size and population.

    Across the three-county area, total expenses scores range from 84–92%, indicating greater levels of spending by nonprofit arts and cultural organizations than in the majority communities across the country. And while government support is largely consistent with the total expenses in each county, Montgomery County shows a striking disparity with a Government Support Score of 20 compared to a score of 86 in total expenses. 

    Learn more about arts attendance and jobs in the arts in Houston

    Data Note: 

    * The Arts Vibrancy Index includes 12 measures that fall under three main rubrics: total arts providers, considering the number of independent artists, arts and culture employees, nonprofit arts and cultural organizations and arts, culture and entertainment firms in the community; total arts dollars in the community, including earned revenue from program activities, contributed revenue supporting the arts, total compensation to artists and staff and total expenses; and public support using state and federal arts funding.

    Helpful Articles by Understanding Houston:

    Resources

    References:

    1. Jackson, M.-R., Kabwasa-Green, F., & Herranz, Jr., J. (2006).Cultural Vitality in Communities: Interpretation and Indicators. Retrieved from Urban Institute website.
    2. Patterson, G., & Binkovitz, L. (2019). Artist-Planner Collaborations: Lessons Learned from the Arts and Culture Ecosystems of Three Sun Belt Cities for a New Model of Inclusive Planning. Retrieved from The Kinder Institute for Urban Research website.
    3. Arts, Culture, and Community Mental Health. (2019, April 19). Retrieved June 28, 2019.

  • Arts

    Arts

    Understanding Arts and Culture in Houston

    As of August 2021, the data on this page will no longer be updated. While the content remains accessible for reference, please note that it does not reflect the most current information. If you’d like to explore the most up-to-data data available, please refer to:

    How our region’s creative resources benefit residents — some more than others

    The importance of art in our communities extends far beyond entertainment. Houston’s vibrant creative community also has tremendous benefits for both our economy and our diverse population. However, those benefits are not spread equally through our region, as certain areas remain underserved and underfunded. By working to increase the accessibility of arts throughout the Houston area, we can create valuable opportunities and improve the quality of life for residents across the region.

    And the more we know about arts and culture in Houston, the more we can enrich our lives, enhance our community, and support our creative economy. 

  • Air & Water Quality

    Air & Water Quality

    Air and Water Quality

    Air and water quality has improved over the last couple decades but remain at levels that can harm public health, particularly the most vulnerable.

    Despite improvement in water and air pollution levels in Houston’s three-county region over the last two decades, People of Color and low-income communities continue to bear a disproportionate burden of an unhealthy environment.

    Why air and water quality matters to Houston

    Nothing is more essential to sustaining life than air and water. Houston used to be known as the nation’s smog capital in the 1990s, but the region has made significant strides since then to clean its air. However, air pollution levels caused by growing industries, heavy traffic and a car-dependent culture remain a persistent problem for the Houston region. Additionally, the Houston area has vast water resources, including a great number of major rivers and streams running across the state that support our region. These water resources support both natural ecosystems and human habitation. However, in highly-developed urban areas — particularly those accustomed to flooding like the Houston region — urban waterways take on concentrated pollution from industrial discharges, vehicles, residential and commercial wastewater, trash and polluted stormwater runoff.

    Contaminated air and water poses serious health threats for residents and the environments they live in. High levels of ozone and particle population have been found to lead to premature death and other health conditions like respiratory illnesses, cancer, asthma attacks, cardiovascular damage, and developmental and reproductive damage.1 Across the U.S., about 50,000–100,000 excess deaths are attributed to air pollution.2 And contaminated water can lead to illnesses and even cause death. What’s more, our most vulnerable residents — people of color, low-income communities, young children, and older adults — tend to be disproportionately affected by environmental hazards, both in terms of higher exposure levels and more severe health outcomes.3 4

    The more we know about Greater Houston’s air quality and water quality, particularly in our region’s most vulnerable communities, the better equipped we are to take informed action in order to protect these essential resources for future generations.

    The data

    Ozone, particle pollution and toxic waste releases contribute to poor air quality in urban areas

    Though improving, high ozone levels still undermine public health in the Houston area

    Ozone can be “good” or “bad” depending on where it is found in the atmosphere. Stratospheric ozone is “good” because it occurs naturally in the upper atmosphere and protects living things from harmful ultraviolet radiation from the sun. “Bad” ozone is found at the ground level and is often called “smog.” Ozone can cause immediate breathing problems and is associated with many negative health outcomes, including asthma and even premature death.5

    Ground-level ozone is not emitted directly into the air. Instead, it is formed when heat and sunlight cause chemical reactions between oxides of nitrogen (NOx) and volatile organic compounds (VOC). These chemicals are produced primarily from cars and industrial processes. Since ozone is most likely to reach unhealthy levels on hot days in urban areas, typically the ozone readings reach the highest values between April and September in the region.

    In December 2020 the National Ambient Air Quality Standards for ground-level ozone were set at 0.070 parts per million (ppm) averaged over an 8-hour period. This is the same standard that was set in 2015 and is lower than the 2008 standard of 0.075 ppm.

    Since 2000, there has been a significant decrease in the number of days in which ozone levels were above EPA standard in our region. Harris County saw the number of days above standard fall 64%, from 70 days in 2000 to 25 in 2018. Montgomery County saw a similar decrease of 77%, from 47 days in 2000 to 11 in 2018. 

    While Houston has experienced long-term progress, data from recent years show a modest uptick in the number of days where ozone levels were dangerously above standard. Harris County saw the number of days above standard increase from 17 days in 2016 to 25 in 2018, while Montgomery saw an increase from 4 days in 2016 to 11 in 2018. Across the U.S., ozone levels have not decreased at the rate they were previously indicating stalling progress on improving air quality.6 Ozone levels in Greater Houston also remain high compared to the rest of the country, according to the most recent State of the Air report by the American Lung Association, which rated the ozone levels in Harris and Montgomery as an “F.”

    According to the most recent State of the Air report by the American Lung Association, which rated the ozone levels in Harris and Montgomery as an “F.”

    The amount of particulate matter in Houston’s three-county region is below national standards but remains higher than national rates

    Particle pollution, or particulate matter (PM), refers to small solid and liquid particles, like soot, found in the air. These particles are released into the air by different industrial processes, fires, dust, or formed from vehicle exhaust. While these particles are so microscopic they cannot be detected individually, when millions are present, they can reduce visibility and cause haze.

    Particles less than 2.5 micrometers in diameter are referred to as PM2.5, and because of their size, they are easily inhaled by humans. In 2019, the EPA determined that both short-term and long-term exposure to PM2.5 causes early death.7 PM2.5 particles pose the greatest risk to health through cardiovascular and respiratory diseases, and vulnerable populations, including children and older adults, have higher chances of being affected. 

    In December 2020, the U.S. Environmental Protection Agency (EPA) decided to retain the 2012 National Ambient Air Quality Standard for PM2.5 at the annual average level of 12 micrograms per cubic meter of air (µg/m3) for another five years. However, in June 2021 the EPA announced it would reexamine the standard, given the scientific evidence of the harm to people’s health. It expects to have a final rule in Spring 2023.

    Does Houston have good air quality, as measured by particle pollution? In the Houston Metropolitan Statistical Area (MSA), the annual average concentration of PM2.5 has decreased from 13.1 µg/m3 in 2000 to 10.1 µg/m3 in 2020. This represents a 23% improvement in air quality. While this indicates progress, the reduction of air pollution in Houston has not kept up with the national trend, where PM2.5 levels fell 41% during the same time period.

    As with ozone levels, there has been a leveling off of improvement in particulate matter pollution in recent years.8 This trend is also seen across the U.S and Europe and reflects the challenges to reducing PM2.5 concentrations at lower levels, even with the enforcement of long-term policies like the Clean Air Act.9

    Levels of contamination in Houston-area drinking water and water bodies remain a public health concern

    Clean and safe drinking water helps prevent illness, birth defects and even death.10 To ensure the water is safe for human consumption, public water systems are frequently checked to verify that the levels of contaminants present in the water do not exceed the Maximum Contaminant Levels set by the EPA. As of July 01, 2021, Texas regulates 7,053 public water systems, providing drinking water to more than 29.5 million customers.

    Water violation levels threaten the safety of Houston’s drinking water

    According to the Safe Drinking Water Information System (SDWIS) federal reporting system, Harris County had a total of 1,595 drinking water violations reported from its active facilities in 2020. It had the most drinking water violations among the three counties, but it is difficult to determine the exact population impacted by each violation. Fort Bend and Montgomery counties have fewer water violations reported. Additionally, not all violations are equivalent; testing date, frequency and location can also affect the detection and severity of violations.

    The majority of area water sources are bacteria-impaired

    Ground and surface refer to the naturally occurring water sources beneath and above the Earth’s surface, respectively. While about 80% of the groundwater in Texas is used for agricultural purposes, mostly for irrigation, the Houston region also relies on groundwater for domestic and industrial usage.

    When a water source becomes polluted or otherwise contaminated, it is considered to be impaired. In heavily populated areas like Houston, the most common contaminants of groundwater come from petroleum storage tank facilities.

    What does this mean for Greater Houston’s water quality? Overall, 67% of the water streams found in the three-county area are currently impaired because of bacterial contamination, making their water unsafe. When bacteria concentrations in the water are too high, people swimming, fishing or boating in the water can become ill if they ingest the water. Some of the most common contributors of bacterial contamination are malfunctioning wastewater treatment plants, sanitary sewer system overflows, and failing onsite sewer facilities and septic systems. Severe storms and flooding can also exacerbate contamination in regional waterways, particularly in regions accustomed to flooding.

    Continue reading about flooding in Houston

    Harris County has the most miles of impaired streams, about 530 miles in total, compared to 227 miles in Montgomery County and 48 in Fort Bend County. As a percentage of all stream miles, Harris County and Fort Bend have a higher proportion of contaminated streams (71% and 72%, respectively) than Montgomery County (59%). More miles are impaired in Fort Bend and Montgomery counties today than a decade ago with levels in Harris County relatively flat.

    Toxic chemicals can be found in our air, water, and land, affecting our collective health

    What causes water pollution, other than bacteria? Toxic chemical waste released by industrial facilities also greatly affects Greater Houston’s water quality. In the U.S., industrial facilities that meet certain criteria must report the amount of chemicals that are released into the environment. This information is released to the public through the EPA’s Toxic Release Inventory (TRI). Not all toxic chemicals used in the U.S. are reported. However, TRI does monitor those that may pose a threat to human health and the environment. As of 2021, the TRI chemical list included 770 individual chemicals and 33 chemical categories.

    Houston’s three-county region releases a smaller share of chemical waste into the environment than Texas and the nation

    Toxic waste from facilities can be managed in different ways. According to the EPA, the preferred management method is recycling, followed by energy recovery, treatment, and as a last resort, disposing or releasing the waste to the environment.

    In 2019, Texas ranked 26th highest out of the 56 states and territories nationwide for total on-site and off-site disposal or other releases per square mile. Both Houston’s three-county region (25.9%) and Texas (24.4%) recycle about one-fourth of its toxic chemicals, compared to the national rate of 53%. However, Texas releases a smaller share of these toxic chemicals into the environment. In Texas, 192 million pounds (or 5%) of production-related waste was disposed of or released into the environment. For comparison, the U.S. released 11%. 

    Houston’s three-county region (25.9%) and Texas (24.4%) recycle about one-fourth of its toxic chemicals, compared to the national rate of 53%.

    At a local level, while Harris County released more total waste (46 million pounds) than Fort Bend (2.7 million pounds) and Montgomery (0.7 million pounds) counties, Harris County released a smaller proportion of that waste (3.5%) into the environment. Montgomery County released 12.7% and Fort Bend released 27.3% of its waste into Houston’s environment.

    Despite a reduction in chemical releases, millions of pounds of toxic chemicals are released into our environment

    A “release” refers to different ways that toxic chemicals from industrial facilities enter the air, water and land. Releases include spilling, leaking, pumping, pouring, emitting, emptying, discharging, injecting, escaping, leaching, dumping, or disposing into the environment. In Texas, of the 158.7 million pounds of toxic chemicals disposed of or released on-site, 57% was disposed of on land, 32% emitted into the air, and 11% was released into the water.

    The amount of toxic chemicals industrial facilities released on-site in Houston’s three-county region has declined significantly in the last 15 years. Between 2005 and 2019, the three-county Houston area has reduced the amount of toxic chemicals released on-site by 23.4% from nearly 50.1 million pounds to 38.8 million pounds, respectively. The greatest reductions were seen in the levels released into the air (41.0%) while the amount released in water increased about 10.3% during the same time period. Fort Bend reduced its on-site chemical releases 40.4% between 2005 and 2019 with the substantial reductions across air, water, and land. Toxic chemicals released on site fell 21.5% in Harris County and 62.1% in Montgomery County during the same time period.

    More recently, Fort Bend released 2.1 million pounds of toxic chemicals on-site in 2019, with 1.5 million pounds placed in some type of land disposal and 650,000 pounds released into the air. Montgomery had 796,000 pounds of chemicals that were not recycled, recovered, or treated in the same year. Of those, 527,000 pounds were disposed off-site, while 268,000 pounds were emitted on-site into the air. For Harris County, of the 46.6 million pounds of waste either being disposed of or emitted, 22 million pounds were disposed of on land, 10.6 million pounds were released into the air, and 3.6 million were released into water.

    Read about renewable energy and climate change in Houston

    People of Color are disproportionately impacted by air, water, and land pollution

    Black and Hispanic residents are more likely to live in areas with a higher exposure to air, water, and land pollution than white Americans.11 Recent research has also shown that while white Americans cause more pollution through consumption, non-white populations suffer more from that pollution.12

    The Department of Energy defines environmental justice as “the fair treatment and meaningful involvement of all people, regardless of race, color, national origin, or income, with respect to the development, implementation, and enforcement of environmental laws, regulations, and policies.” More succinctly, environmental justice refers to the principle that all people should have access to clean and healthful environments and that the burdens of pollution are not carried by only certain groups. To promote transparency of this issue, the EPA developed EJSCREEN—a publicly-available tool that shows where environmental burdens may not be shared equally. 

    As part of the EJSCREEN toolkit, EPA created 11 EJ indexes. Each index looks at a single environmental factor and combines it with a demographic component to understand the “excess environmental risk” faced by People of Color and low-income individuals. EJSCREEN allows for comparisons of a community to the rest of the state, EPA region, and nation, by using percentiles. A percentile is a relative term, and tells us how an area’s performance compares to a particular group (e.g., other counties in Texas, other counties in the U.S.). So, a county with a percentile of 80 on a particular EJ Index means that the county has higher risk on that environmental factor given its demographic composition than 80% of other counties in Texas (or the nation, depending on the comparison).

    When compared to the rest of the state, Fort Bend and Harris counties are worse than the median in each of the five air-quality measures, meaning they’re worse not only because of Houston’s air quality itself, but also because of the racial inequality in exposure to those hazards compared to other counties in Texas. Fort Bend County performs worse than 71% of other counties in Texas on particulate matter (both the levels and the excess risk borne by People of Color and low-income communities). However, when compared to the nation, Fort Bend County performs worse than 86% of counties. While Montgomery County performs better than most other Texas counties on the same measures, Montgomery County has the least racial/ethnic diversity among the three Houston-area counties which affects its score.

    Similar trends emerge for EJ indexes that focus on waste and water quality. Proximity to superfund sites on the National Priorities List (NPL) is higher for all three counties compared to the rest of the state and nation. Fort Bend and Harris also have higher environmental justice issues surrounding hazardous waste facilities and sites that use certain flammable and toxic substances, also known as Risk Management Plan sites. One area where all three counties in the region perform better than other counties in Texas and the U.S. is in wastewater discharge.

    EJSCREEN also produces maps that show which block groups have disproportionate risk to unhealthy environments. The higher the percentile, the higher the environmental harm to People of Color and low-income populations relative to the state (or nation).

    Helpful Articles by Understanding Houston:

    Resources

    References:

    1. U.S. Environmental Protection Agency, “Ground-level Ozone Pollution – Health Effects of Ozone Pollution,” last modified May 5, 2021.
    2. U.S. Environmental Protection Agency, Air Quality Criteria For Ozone And Related Photochemical Oxidants (Final Report, 2006), by the U.S. Environmental Protection Agency (EPA/600/R-05/004aF-cF), Washington, DC, 2006. Web.
    3. Bullard, R. D. (1983). Solid waste sites and the black Houston community. Sociological inquiry, 53(2‐3), 273-288.
    4. Bullard, R. D. (Ed.). (1993). Confronting environmental racism: Voices from the grassroots. South End Press.
    5. U.S. EPA. Integrated Science Assessment (ISA) for Ozone and Related Photochemical Oxidants (Final Report, Apr 2020). U.S. Environmental Protection Agency, Washington, DC, EPA/600/R-20/012, 2020.
    6. Zhe Jiang, Brian C. McDonald, Helen Worden, John R. Worden, Kazuyuki Miyazaki, Zhen Qu, Daven K. Henze, Dylan B. A. Jones, Avelino F. Arellano, Emily V. Fischer, Liye Zhu, K. Folkert Boersma. “Unexpected slowdown of US pollutant emission reduction in the past decade.” Proceedings of the National Academy of Sciences, 2018; 201801191 DOI: https://doi.org/10.1073/pnas.1801191115
    7. U.S. EPA. Integrated Science Assessment (ISA) for Particulate Matter (Final Report, Dec 2019). U.S. Environmental Protection Agency, Washington, DC, EPA/600/R-19/188, 2019.
    8. Clay, K., Muller, N. Z., & Wang, X. (2021). Recent increases in air pollution: evidence and implications for mortality. Review of Environmental Economics and Policy, 15(1), 154-162.
    9. Shaddick, G., Thomas, M.L., Mudu, P. et al. Half the world’s population are exposed to increasing air pollution. npj Clim Atmos Sci 3, 23 (2020). https://doi.org/10.1038/s41612-020-0124-2
    10. Craun, Gunther F., et al. “Causes of outbreaks associated with drinking water in the United States from 1971 to 2006.” Clinical Microbiology Reviews 23, no. 3 (2010): 507-528.
    11. Brulle RJ, Pellow DN. “Environmental justice: human health and environmental inequalities.” Annu Rev Public Health. 2006; 27:103-24. doi: 10.1146/annurev.publhealth.27.021405.102124. PMID: 16533111.
    12. Tessum et al., “Inequity in Consumption of Goods and Services Adds to Racial–Ethnic Disparities in Air Pollution Exposure.” PNAS March 26, 2019 116 (13) 6001-6006; https://doi.org/10.1073/pnas.1818859116.
  • Renewable Energy & Climate Change

    Renewable Energy & Climate Change

    Renewable Energy & Climate Change in Houston

    As our region continues to experience the effects of climate change, the role of renewable energy sources grows more important.

    While current greenhouse gas emission levels in Greater Houston have remained flat in the last decade, our region has become hotter and wetter. Climate change risks are projected to increase in the future, posing threats to Houstonians’ health and prosperity.

    Why climate change and renewable energy matters to Houston

    Climate change is generally understood to be a series of changes in our global weather, oceans, and ecosystems, and that these changes are due to a buildup of greenhouse gases in our atmosphere that cause the planet to warm. Ninety-seven percent of climate scientists have published research finding that man-made factors are causing average temperatures to rise. This warming means more people will continue to die from heat, particularly older adults and young children; we will experience more frequent, intense, and destructive storms due to warming oceans; increased flooding in coastal communities from rising sea-levels; and could potentially destroy flora and fauna species.

    While some believe the effects of climate change in Houston may not be this disastrous, many experts predict that climate change will cause displacements and force migrations as people flee hardest-hit regions, the Gulf Coast being one of them.1 Because of its proximity and size, the Houston region could be a prime destination for displaced folks leaving flooded low-lying coastal areas.2 The 2018 National Climate Assessment estimates that the U.S. economy could shrink by 10%,3 and the three-county region’s GDP could contract between 6-7% because of the effects of climate change.4 While transitioning to renewable energy from fossil fuels isn’t the only solution to combating the effects of climate change,5 it is believed to help.

    The more we understand how our region contributes to climate change and how it impacts our residents — particularly the most vulnerable6 — the more we can do to make the improvements and adjustments necessary for a more livable future, particularly for our most vulnerable residents.

    The data

    Greenhouse gas emissions in the three-county region remain flat

    Gases that trap in heat from the sun are called greenhouse gases (GHGs). Many chemical compounds act as greenhouse gases and, without naturally occurring ones, the earth would be too cold to support life as we know it. However, since the Industrial Revolution began 150 years ago, human-caused greenhouse gas emissions emissions have increased, with the rate of growth accelerating dramatically starting in the 1950s. The change in the concentration of GHGs in the atmosphere has resulted in more heat being trapped on Earth. This has caused the Earth’s average temperature to increase, a phenomenon known as climate change.

    The main greenhouse gases include carbon dioxide (CO2), methane (CH4), nitrous oxide (N2O), and fluorinated gases (e.g., hydrofluorocarbons caused by industrial processes). While ozone is technically a greenhouse gas, it is not included in either U.S. or international GHG counts because its protective benefits in the stratosphere outweigh its contribution to the greenhouse effect. In 2019, carbon dioxide accounted for 80% of the greenhouse gas emissions in the U.S. Burning fossil fuels, like coal, natural gas and oil, is the main contributing factor to the high releases of CO2 into the atmosphere.

    Greenhouse gases are emitted from a variety of different industries and uses. Fossil fuels used to generate electricity and produce industrial goods account for 48% of greenhouse gas emissions in the U.S. The U.S. Environmental Protection Agency (EPA) reports facility-level GHG data from major industrial sources across the U.S. through its Greenhouse Gas Reporting Program (GHGRP)

    In 2019, large direct-emitting facilities (e.g., industrial plants) in the U.S. produced 2,850 million metric tons (MMT) of GHG emissions. Facilities in Texas produced 380 MMT of GHG emissions in 2019. This represents 13% of all GHG emissions for the entire nation, which is more than double that of any other state’s emission level.

    In 2019, Texas facilities produced 380 MMT of greenhouse gas emissions — double that of any other state’s emission level.

    In the three-county Houston region, facility-level greenhouse gas emissions totaled 67.9 MMT in 2019, essentially flat from 67.5 MMT in 2011. In 2019, Harris County produced 52 MMT of GHG emissions, accounting for over 75% of the region total; Fort Bend released 14 MMT, lower than the amount emitted in 2011; and Montgomery emitted 1 MMT.

    While the industrial and energy sectors produce large amounts of greenhouse gases, the transportation sector is the largest contributor to GHG in the U.S. — it accounts for 29% of all GHG emissions. In general, driving-related emissions for households living in location-efficient urban neighborhoods (typically characterized by walkable streets, easy access to transit, proximity to jobs, mixed land uses, and concentrations of retail and services) are half or less of what they are for households in the least-efficient, car-dependent neighborhoods. According to C40 Cities, a network of international megacities committed to addressing climate change, the city of Houston transportation sector alone produced 17 MMT of greenhouse gas emissions in 2019.

    Continue reading about Houston’s air quality and water quality

    Houston’s environment is hotter and wetter than it was a decade ago

    Ninety-seven percent of actively-publishing climate scientists agree that climate-warming trends are extremely likely due to human activities, primarily the burning of fossil fuels. Most of the warming that scientists have observed has occurred in the past 40 years, with the seven most recent years being the warmest. The years 2016 and 2020 are tied for the warmest year on record. And, as the climate continues to warm, the chance for extreme weather increases.7

    In May 2021, the National Oceanic and Atmospheric Administration (NOAA) released its decennial U.S. Climate Normals, which are 30-year averages. It showed that Houston’s environment is hotter and wetter than it was a decade ago. Average temperatures in the region increased between 0.6 to 1.0 degrees Fahrenheit and annual rainfall increased by about two inches compared to the previous 30-year averages. While the Climate Normals were not developed to track or document climate change, the difference between each installment does provide some evidence of climate change.

    Average temperatures in the region increased between 0.6 to 1.0 degrees Fahrenheit and annual rainfall increased by about two inches compared to the previous 30-year averages

    Houston is getting hotter for longer, putting our most vulnerable residents at risk

    Greater Houston residents are well aware of how uncomfortable the summer heat can be. But extreme heat (defined by the Centers for Disease Control and Prevention, or CDC, as 95°F or hotter) can also cause illness and in some cases, deathExtreme heat kills more Americans than other weather-related disasters, and the World Health Organization states that temperature extremes can exacerbate chronic cardiovascular, respiratory and diabetes-related conditions. Seniors, young children and people with mental illness and chronic disease are at the highest risk of heat-related illnesses.

    Continue reading about vulnerability to disasters and the Social Vulnerability Index

    In the last decade the number of days with temperatures over 95°F rose significantly across the region. In the 2010s, Montgomery County had over 500 days with temperatures over 95° compared with fewer than 300 days in the previous decade. This is an increase of 231 days, equivalent to nearly two-thirds of a year, worth of extreme heat, in one decade. Fort Bend and Harris Counties also saw a 70% and 87% increase, respectively, in the number of days with extreme heat between the two decades.

    Compared to the decade prior, Montgomery County experienced an increase of 231 days of extreme heat — equivalent to nearly two-thirds of a year.

    Heat islands worsen as overall temperatures rise

    Temperatures are not consistent across counties. In fact, research shows that temperatures can vary by neighborhoods within the same city. These pockets of heat are known as “heat islands.” Heat islands occur in places with a preponderance of built infrastructure like parking lots, roads and buildings, which retain heat during the day and radiate that heat back into the surrounding air. They provide less shade and moisture than natural landscapes such as tree canopy and bodies of water and, consequently, contribute to higher temperatures. While heat islands can be found anywhere, they are typically a characteristic of urban areas, particularly during the summer months.

    While heat islands are not caused by climate change or the increase in temperatures from greenhouse gases in the atmosphere, because climate change is increasing the intensity of heat and other weather events, heat islands are also being intensified, raising temperatures even higher.

    The heat island effect results in daytime temperatures in urban areas about 1–7°F higher than temperatures in outlying areas and nighttime temperatures about 2–5°F higher, according to the 2017 Climate Science Special Report. In a 2021 report by Climate Central, Houston ranks fourth in the nation in highest urban heat island intensity, behind New Orleans, Newark, N.J., and New York City.

    Houston ranks fourth in the nation in urban heat island intensity.

    Houston neighborhoods that have the highest nighttime temperatures — the greatest driver of heat-related health issues — are most likely to occur in low-income areas and communities of color, according to maps created by Houston Harris Heat Action Team (H3AT).

    Evening Temperatures

    Dramatic differences in temperature have dire health consequences. FEMA warns that extreme heat kills more Americans than other weather-related disasters, and the World Health Organization states that temperature extremes can exacerbate chronic cardiovascular, respiratory and diabetes-related conditions.

    The number of extreme precipitation events in Houston has increased significantly

    Since 1980, 12 rain events in our region have been declared disasters by FEMA and four have occurred since 2015. These 12 events are not associated with hurricanes or tropical storms and indicate our region’s increased vulnerability to intense rainstorms. Heavy precipitation is becoming more intense and more frequent across most of the United States. 

    Extreme precipitation is related to climate change  in that, all else being equal, a warmer atmosphere can “hold” more water vapor, and therefore deliver more rainfall when conditions for heavy precipitation events occur. The more intense rainstorms are, the likelihood of flooding increases, along with the resulting economic and public health damages. And, as flooding increases, local municipalities will search for ways to mitigate damages by building reservoirs and retention ponds.

    Observed Change in Total Annual Precipitation Falling in the Heaviest 1% of Events
    Source: USGCRP, 2018: Impacts, Risks, and Adaptation in the United States: Fourth National Climate Assessment, Volume II

    A comparison of rainfall across two time periods (1901–1960 versus 1986–2016), shows that for the majority of the country, more of the precipitation that falls each year is falling as part of a heavy precipitation event (defined as the top 1% of all days with precipitation during the reference period). In the region that includes Texas, Oklahoma, and Kansas, the precipitation that falls each year as part of a heavy precipitation event is 24% higher than it was in the first half of the 20th century.

    Across the region the number of extreme precipitation days continues to increase. In Montgomery County, the number of days with 1 inch of rain increased from 84 in the 1980s to 120 in the 2010s, a 43% increase. Fort Bend and Harris counties also experienced similar increases, 37% and 25% respectively. 

    The increase in extreme precipitation is shown even more prominently when looking at days with 3 or more inches of rain. Each county saw three or fewer days with rain over 3 inches for the entire 1980s decade, but by the 2010s each county experienced between 12 and 17 days of this type of extreme precipitation.

    Continue reading about flooding in Houston

    Climate change can also increase the possibility and duration of droughts as evaporation increases, making periods with low precipitation drier than they would be in cooler temperatures. Although typically more common in the west, Texas saw a record breaking drought in 2011, whose effects were felt across the Houston region as well. The extreme dry weather led to wildfires that FEMA declared a disaster and destroyed 74 homes in Montgomery County. Across the region, millions of trees were lost with over half the trees in Memorial Park dying.

    Continue reading about natural disasters in Houston

    Climate change in Houston could mean a future where one-fifth of the year is above 95°F, rainstorms are more intense, and dry periods last longer

    Why is Houston so hot right now? And why is it only getting hotter? The effects of the warming climate are likely to continue this pattern of extreme weather. To model the effects of climate change the U.N.’s Intergovernmental Panel on Climate Change uses four Representative Concentration Pathways (RPCs). RPCs are scenarios that describe the trajectories of carbon dioxide emissions.

    The U.S. government developed Climate Explorer as part of its Climate Resilience Toolkit to show how different climate conditions are projected to affect the local areas across the nation in the coming decades. Locally, the Houston Advanced Research Center (HARC) created the Resilience Science Information Network (RESIN) Portal of the Upper Texas Gulf Coast to measure future climate conditions for nine counties in the Houston area. Both the U.S. Climate Explorer and RESIN use the moderate emission (RCP4.5) and higher emission (RCP8.5) scenarios to capture the range of possible climate futures.

    The U.S. Climate Explorer shows that even under a moderate emissions scenario (RPC4.5), all three counties will experience over 50 days of extreme heat by 2030. In Montgomery County, the number of days with temperatures above 95°F is expected to increase to 72 days a year by 2030, or 20% of the year. For comparison, between 1969 and 1990, Montgomery County averaged 36.5 days of extreme heat. This forecast is nearly double this historic average.

    Forecasts for days above 95° in 2030 are lower for Fort Bend and Harris counties at 54 and 57 days a year, respectively. The risk for each county continues to rise over the next 80 years. By 2090, all three counties could experience nearly 80 days of extreme heat a year.

    In Houston, climate change has affected “Normal” temperatures but the precipitation forecasts are more nuanced. According to the Resilience Science Information Network (RESIN), “the average annual precipitation amounts are not projected to change significantly in total; however, the season in which the precipitation occurs will” (emphasis added). Climate scientists predict that our summers will be longer and characterized by lengthy heatwaves, more hot days and nights, and less rainfall as a result of climate change in Houston. By the 2090s Houston could see a 5-inch decline in annual rainfall mostly occurring in the summer. Essentially, when it does rain, it is expected to be more intense, but there is also the possibility of longer periods without rain.

    While the annual amount of rain may not change significantly, the IPCC forecasts globally that the number of extreme precipitation days will worsen in the coming years as climate change releases more water vapor into the air.9 The forecast for Texas and Houston is no exception.10 Importantly for the Houston region, while the number of hurricanes in Houston is not projected to increase year-to-year, the warmer air and oceans temperatures will increase the strength of the hurricanes that do make landfall near us.11

    Texas produces a larger share of its energy from renewables than the nation

    In the U.S., 40% of energy consumed is used to generate electricity. Unlike traditional sources of electricity (like coal, petroleum, natural gas, and nuclear fuels), electricity produced from renewable resources (like wind, solar, biomass, and hydroelectric) generally does not contribute to climate change or local air pollution as they produce very little or no greenhouse gases.

    Across the nation, renewable energy generation surpassed coal-fired generation for the first time in April 2019. In Texas, the share of power produced from renewable sources has outpaced the nation. In 2001, less than 2% of all fuel generation in the U.S. was generated by renewable energy, and even less was generated in Texas. By 2020, 12% of all fuels generated in the U.S. were from renewable energy while in Texas, 23% of all fuels generated came from renewable energy, nearly double the national rate.

    Hydroelectric was the main source of renewable energy in the nation until 2019 when wind became more prevalent. Comparatively, almost all of the renewable energy generation in Texas over the past 20 years has come from wind, with solar increasing in recent years.

    Despite its prominence across Texas, the production of wind energy in Greater Houston is not as feasible as solar. In recent years, homeowners have begun installing more solar panels. In the City of Houston, homeowner-installed solar capacity grew from 9.5 megawatts in 2017 to 42.5 at the end of 2019. The City of Houston is also committed to producing more solar energy and, in 2021, approved the conversion of a former landfill in the Sunnyside neighborhood into a solar farm.

    In 2020, the City of Houston announced its Houston Climate Action Plan that aims to reduce greenhouse gases emissions, meet the Paris Agreement goal of carbon neutrality by 2050, and lead the global energy transition. The City of Houston’s commitment to renewable energy has earned it the #1 spot on the EPA’s Green Power Partnership list of Top 30 Local Governments.

    Helpful Articles by Understanding Houston:

    Resources

    References:

    1. Kulp, S.A., Strauss, B.H. New elevation data triple estimates of global vulnerability to sea-level rise and coastal flooding. Nat Commun 10, 4844 (2019). https://doi.org/10.1038/s41467-019-12808-z
    2. Hauer, M. E. (2017). Migration induced by sea-level rise could reshape the US population landscape. Nature Climate Change, 7(5), 321-325.
    3. USGCRP, 2017: Climate Science Special Report: Fourth National Climate Assessment, Volume I [Wuebbles, D.J., D.W. Fahey, K.A. Hibbard, D.J. Dokken, B.C. Stewart, and T.K. Maycock (eds.)]. U.S. Global Change Research Program, Washington, DC, USA, 470 pp, doi: 10.7930/J0J964J6.
    4. Hsiang, S., Kopp, R., Jina, A., Rising, J., Delgado, M., Mohan, S., … & Houser, T. (2017). Estimating economic damage from climate change in the United States. Science, 356(6345), 1362-1369. Retrieved from https://projects.propublica.org/climate-migration/.
    5. IPCC, 2021: Summary for Policymakers. In: Climate Change 2021: The Physical Science Basis. Contribution of Working Group I to the Sixth Assessment Report of the Intergovernmental Panel on Climate Change [Masson-Delmotte, V., P. Zhai, A. Pirani, S. L. Connors, C. Péan, S. Berger, N. Caud, Y. Chen, L. Goldfarb, M. I. Gomis, M. Huang, K. Leitzell, E. Lonnoy, J.B.R. Matthews, T. K. Maycock, T. Waterfield, O. Yelekçi, R. Yu and B. Zhou (eds.)]. Cambridge University Press. In Press.
    6. EPA. 2021. Climate Change and Social Vulnerability in the United States: A Focus on Six Impacts. U.S. Environmental Protection Agency, EPA 430-R-21-003. Retrieved from https://www.epa.gov/cira/social-vulnerability-report/.
    7. IPCC, 2021: Summary for Policymakers. In: Climate Change 2021: The Physical Science Basis. Contribution of Working Group I to the Sixth Assessment Report of the Intergovernmental Panel on Climate Change [MassonDelmotte, V., P. Zhai, A. Pirani, S. L. Connors, C. Péan, S. Berger, N. Caud, Y. Chen, L. Goldfarb, M. I. Gomis, M. Huang, K. Leitzell, E. Lonnoy, J. B. R. Matthews, T. K. Maycock, T. Waterfield, O. Yelekçi, R. Yu and B. Zhou (eds.)]. Cambridge University Press. In Press.
    8. IPCC, 2014: Summary for policymakers. In: Climate Change 2014: Impacts, Adaptation, and Vulnerability. Part A: Global and Sectoral Aspects. Contribution of Working Group II to the Fifth Assessment Report of the Intergovernmental Panel on Climate Change [Field, C.B., V.R. Barros, D.J. Dokken, K.J. Mach, M.D. Mastrandrea, T.E. Bilir, M. Chatterjee, K.L. Ebi, Y.O. Estrada, R.C. Genova, B. Girma, E.S. Kissel, A.N. Levy, S. MacCracken, P.R. Mastrandrea, and L.L.White (eds.)]. Cambridge University Press, Cambridge, United Kingdom and New York, NY, USA, pp. 1-32.
    9. IPCC, 2021: Climate Change 2021: The Physical Science Basis. Contribution of Working Group I to the Sixth Assessment Report of the Intergovernmental Panel on Climate Change [Masson-Delmotte, V., P. Zhai, A. Pirani, S. L. Connors, C. Péan, S. Berger, N. Caud, Y. Chen, L. Goldfarb, M. I. Gomis, M. Huang, K. Leitzell, E. Lonnoy, J. B. R. Matthews, T. K. Maycock, T. Waterfield, O. Yelekçi, R. Yu and B. Zhou (eds.)]. Cambridge University Press. In Press. https://www.ipcc.ch/report/ar6/wg1/#SPM.
    10. Runkle, J., K. Kunkel, J. Nielsen-Gammon, R. Frankson, S. Champion, B. Stewart, L. Romolo, and W. Sweet, 2017: Texas State Climate Summary. NOAA Technical Report NESDIS 149-TX, 4 pp. https://statesummaries.ncics.org/chapter/tx/.
    11. Stoner, A. and Hayhoe, K. 2020. Climate Impact Assessment for the City of Houston. Retrieved from http://www.greenhoustontx.gov/reports/Climate-Impact-Assessment-2020-August.pdf.

  • Environment

    Environment

    Understanding environment amid a changing climate in Houston

    How our region’s air and water quality and climate change impacts affect our environment, health and future well-being

    Fundamental to our existence are clean air, potable water, and temperatures being “just right” on Earth. And while eight billion people share this planet, most environmental impacts are felt locally — and unevenly. Despite improvement in air and water pollution levels in Houston’s three-county region over the last two decades, historically marginalized and low-income communities continue to bear a disproportionate burden and risk of an unhealthy environment. Nationally, those from marginalized communities are over three times more likely to be breathing the most polluted air than white people. 

    Contaminated air and water poses serious health threats for residents and the environments they live in. Compounding these health effects, Houston is hotter and wetter than it was a decade ago. Our location, topography, and climate make us particularly vulnerable to climate change and extreme weather conditions which will continue to occur at greater intensities and with more frequency. The cumulative effects of climate change could potentially displace millions of people and threaten our economic output.

    The more we know about our local air and water quality and how climate change will continue to impact our region, the more we can do to make the adjustments necessary for a more livable future, particularly for our residents who bear the greatest risks.

  • Housing Vulnerabilities

    Housing Vulnerabilities

    Housing Vulnerabilities in Houston

    Unsafe or unstable housing continues to threaten the health, well-being, and economic security of Houston-area residents

    Many low-income households lack the necessary resources to afford soaring rents and bounce back from disasters, leaving them more vulnerable to unsafe housing conditions, eviction or even homelessness.

    Why housing vulnerabilities matter to Houston

    Hundreds of thousands of Houston-area residents face housing insecurity, vulnerability and disparities. For the most part, these are our neighbors who are burdened by housing costs, face economic insecurity, and have been negatively impacted by multiple devastating disasters. These challenges ultimately increase a household’s vulnerability to the next crisis, which can perpetuate a cycle of housing challenges and instability.

    When housing prices rise faster than income growth and more households are forced to allocate more than 30% of thier income to housing, the result is heightened housing insecurity and vulnerability. Natural disasters also contribute to housing vulnerabilities because they tend to damage or destroy the “naturally occurring” supply of affordable housing. Houston-area households have been hit with multiple devastating crises such as Hurricane Harvey in 2017, the COVID-19 pandemic, Winter Storm Uri in 2021, and Hurricane Beryl in 2024. Research has found that neighborhoods with greater pre-existing housing inequities see such inequities exacerbated by disasters because the homes are less able to withstand or recover from flooding or strong winds in the first place — for several reasons, including location (e.g., in a floodplain), infrastructure disinvestment (e.g., lack of storm drainage), use of low-quality materials, or because of damage caused by previous disasters. These obstacles can lead to unsafe and unsanitary housing conditions, overcrowding, evictions, or even homelessness.

    By exploring and understanding housing vulnerabilities in Houston, we can take informed action to increase access to disaster-resilient, safe and affordable housing throughout our region.

    The data

    Fort Bend County saw an increase in the number of housing units with problems.

    Low-income households are more likely to sacrifice quality for cost by living in housing units that have structural issues or deficiencies. Housing problems include units with an incomplete kitchen that lacks running water, stove, or refrigerator, or plumbing that lacks hot and cold piped water, a flush toilet, or a bathtub/shower.

    Housing problems contribute to various health conditions, injuries and poor childhood development. Plumbing issues increase the likelihood of water leaks that promote the growth of mold, which negatively affects respiratory health and increases the likelihood of asthma. Corroded plumbing can increase the risk of lead exposure or poisoning.1

    About 0.4% of occupied housing units in Greater Houston (nearly 9,000 homes) did not have complete plumbing, and 0.7% (over 17,000 units) did not have a complete kitchen. Breaking down the data by county in 2023: Nearly 800 units had incomplete plumbing and 1,800 had incomplete kitchens in Fort Bend County; nearly 7,500 units had incomplete plumbing and over 14,000 had incomplete kitchens in Harris County; and over 650 units had incomplete plumbing and 1,100 had incomplete kitchens in Montgomery County.

    While Houston-area renters are generally more likely to have incomplete kitchens than homeowners, the number of Houston-area housing units with housing problems increased more for homeowners than renters in 2021. This is likely the result of record-breaking Winter Storm Uri that knocked out power and water, caused frozen pipes to burst, and flooded homes across Texas for nearly five days in February 2021. Harris County experienced the worst effects of the storm, but homeowners in Montgomery County experienced the greatest increase in housing problems. Between 2019 and 2021, the number of housing units with incomplete plumbing increased 66% in Houston’s three-county region compared to 13% across the nation; and the number of housing units with incomplete kitchens increased 22% in the region while it remained flat nationally.

    Read more about the impact of natural disasters in Houston

    Between 2019 and 2021, the number of housing units with incomplete plumbing increased 66% in Houston’s three-county region compared to 13% across the nation

    However, the number of housing units with incomplete plumbing did decrease between 2021 and 2023 for Harris and Montgomery counties as well as the state. During this time, Fort Bend County saw an over 880% increase in the number of housing units with incomplete plumbing compared to a 5% increase across the country. Similarly, between 2021 and 2023, Fort Bend County saw a 250% increase in housing units lacking a complete kitchen, compared to a 10% increase in Harris County, 7% in Texas, and 5% across the U.S. In contrast, Montgomery County experienced a 53% decrease in such units.

    One out of 10 Houston-area households that rent are overcrowded

    Overcrowding refers to the compromised health and safety conditions that can occur when many people live in a given space (one or more occupants per room). Families will often crowd in with relatives and friends to avoid homelessness, but people need sufficient space to meet their basic needs. Studies have shown that overcrowding can have a negative impact on physical and mental health, and that it can impede early childhood growth, development and education.2

    Overall, 6% of occupied housing units in Houston’s three-county area are considered overcrowded in 2023, compared to 5% statewide and 4% nationally. Overcrowding is a bigger issue among renters than homeowners — about 10% of Houston-area renter households are overcrowded compared to 3% of homeowners.

    Among the three counties, Harris County has the most overcrowding. Nearly 7% of occupied housing units in Harris County are overcrowded, compared to 3% in Montgomery and Fort Bend counties.

    Since 2010, overcrowding rates have decreased across the state and each of the three counties. However, the number of overcrowded housing units has stagnated in Montgomery County while it has decreased 21% in Fort Bend County, 26% in Harris County, 20% across Texas, and 19% across the U.S.

    Eviction filings in Houston surpass pre-pandemic levels

    An eviction filing is a legal process in which a landlord delivers a written “notice to vacate” and files legal action to evict a tenant from a rental property. Many eviction filings happen because the tenant is late in paying rent, not paying rent at all, or for other reasons listed in the terms of the lease agreement such as damage to the property or illegal use of the property. However, in most American cities and towns—including Houston—landlords can evict renters even if they have not missed a rent payment or otherwise violated their lease agreement; these are called “no fault” evictions, according to Eviction Lab at Princeton University.

    Increasing housing cost burden, job loss or low wages, and an overall lack of affordable housing are among the root causes of evictions. Low-income families, low-income women, domestic violence survivors, and families with children are at high risk for eviction. Evictions force families from their community and support network, and children often have to switch schools. It can also cause job loss, adverse mental health effects, and the loss of possessions. Moreover, evictions can prolong a family’s residential instability as it harms the ability to secure future housing (because of court records) and forces low-income families into a devastating cycle of homelessness, problems that often take years to overcome, if at all.3

    During the COVID-19 pandemic, evictions were suspended across Texas from March 19 to May 18, 2020, though landlords could still give notice of eviction to tenants and file for eviction. In fact, more than 1,500 eviction cases were filed in Harris County during this period, according to January Advisors. Despite the CDC eviction moratorium that took effect on September 4, 2020, only 13% of defendants in Harris County benefited from the mandate. While the suspension of evictions and federal moratorium didn’t completely halt new eviction filings, these protections—bolstered by a surge in funding for rental assistance programs—significantly reduced the number of monthly eviction filings in Houston between March 2020 and December 2021.

    During this period, monthly eviction filings consistently fell below pre-pandemic averages for the same month. However, starting in January 2022, local eviction filings have since begun to surpass their pre-pandemic levels. As of September 2024, monthly eviction filings in Houston have not returned to pre-pandemic levels likely due to several factors such as a growing number of residents living below the poverty line, soaring housing costs for renters, and a higher rate of residents being burdened by housing costs. In 2023, there were 84,000 eviction filings in Houston compared to a pre-pandemic yearly total of 58,000.

    Read more about the impact of COVID-19 on evictions in Houston

    In 2023, there were 84,000 eviction filings in Houston compared to a pre-pandemic yearly total of 58,000

    Homelessness in the Houston area falls 63% in the last decade

    Research has shown that homelessness has long-term consequences, especially to one’s physical and mental health.4,5 Additionally, the public costs incurred from homelessness can be significant for both health and human services and law enforcement.

    According to HUD, there are four categories of homelessness: 1) people who lack nighttime residence and are living in a place not meant for human habitation; 2) those at imminent risk of homelessness and about to lose their home without any other resource; 3) unaccompanied youth under the age of 25 with no stable housing; and 4) people who flee domestic violence with no other residence or support network.

    Additionally, people who experience homelessness can be classified as “sheltered” or “unsheltered.” People who are sheltered (whether they are staying at a homeless shelter in Houston or sleeping on a friend’s couch), typically reside in an emergency shelter or transitional housing, while people who are unsheltered reside in a place not meant for human habitation, such as outdoors or in a condemned building.

    How many people are experiencing homelessness in Houston? Since 2011, homelessness in Harris County has fallen from 8,000 to under 3,000 in 2024. That’s a 63% decrease, while Fort Bend has seen a 90% decline. The number of people experiencing homelessness in Montgomery County has seen an overall increase since 2017, when data started being reported. Even more significant, levels of homelessness in our region fell during a period characterized by one of the largest increases in population in Houston.

    63% decline in Houston-area homelessness between 2011 and 2024

    Certain groups remain at greater risk of experiencing homelessness than others. What percentage of homeless people are veterans in Greater Houston? Among the people who experienced homelessness in Houston’s three-county region in 2023, 9% were veterans. Additionally, 6% were unaccompanied youth, and 17% were considered chronically homeless. HUD defines chronically homeless as experiencing homelessness for at least 12 months or on at least four separate occasions in the last three years (for a total of 12 months). The rate of people who are categorized as chronically homeless in Greater Houston was lower than the state (18%) and the nation (24%).

    The Coalition for the Homeless surveyed people who experienced homelessness in Houston’s three-county area for the annual homeless count and survey, also known as the Point-in-Time Count (PIT), on January 22, 2024. The report found 15% of people experiencing homelessness in the Houston area are under the age of 18, and 79% are over the age of 24; 57% of the local homeless population is Black and 26% is white. Additionally, 33% suffer from a serious mental illness; 26% suffer from a substance use disorder; 13% are victims/survivors of domestic violence, and 2% are HIV-positive.

    Helpful Articles by Understanding Houston:

    Resources

    References:

    1. World Health Organization & World Plumbing Council. (‎2006)‎. Health aspects of plumbing. World Health Organization. https://apps.who.int/iris/handle/10665/43423
    2. Solari, C. D., & Mare, R. D. (2012). Housing crowding effects on children’s wellbeing. Social science research, 41(2), 464–476. https://doi.org/10.1016/j.ssresearch.2011.09.012
    3. Desmond, M., Gershenson, C., & Kiviat, B. (2015). Forced Relocation and Residential Instability among Urban Renters. Social Service Review, 89(2), 227–262. https://doi.org/10.1086/681091
    4. Currie, J., & Tekin, E. (2015). Is There a Link between Foreclosure and Health? American Economic Journal: Economic Policy, 7(1), 63–94. https://doi.org/10.1257/pol.20120325
    5. Shinn, M., Schteingart, J. S., Williams, N. C., Carlin-Mathis, J., Bialo-Karagis, N., Becker-Klein, R., & Weitzman, B. C. (2008). Long-Term Associations of Homelessness With Children’s Well-Being. American Behavioral Scientist, 51(6), 789–809. https://doi.org/10.1177/0002764207311988
    6. Analysis of 2020 data by the U.S. Department of Housing and Urban Development (HUD) because the data for 2021 did not include unsheltered counts in its report due to COVID-19 restrictions.
  • Housing Affordability & Ownership

    Housing Affordability & Ownership

    Housing Affordability & Ownership

    Housing is the single largest expense for most households and has become less affordable for all, especially renters.

    Homeownership rates in Houston’s three-county region have not budged from what they were about a decade ago, and they remain disproportionately low among low-income and non-white households. More households are more likely to rent, reflecting lifestyle changes and barriers often associated with buying a home. However, because rents have risen across Houston and the percentage of affordable housing units has declined, half of Houston-area renters are burdened by housing costs.

    Why housing affordability and ownership matter to Houston

    Housing is the single largest expense for many households and is becoming less affordable. This is problematic since homeownership remains one of the most effective ways to build economic security, social mobility and long-term wealth building. But this epitome of the American Dream — first-time homeownership — is less attainable for the average Houstonian today than a decade ago. The affordability gap — the difference between the median sales price for a home and the price a household with median income could afford (i.e., no more than 30% of income) — has widened. Half of Houston-area renters spend at least 30% of their income on housing costs compared with 24% of homeowners. Paying more for housing means less income is available for other essential needs such as savings, education, child care and health care. Exacerbating affordability issues is the lack of quality and safe housing available with access to public transportation in Houston’s three-county region in economic opportunity areas. With the growth of the renting population, there is a need to ensure renters are protected and represented in our housing policy and disaster resiliency plans.

    The more we understand homeownership and renting trends in our region, the better we can remove barriers for Houstonians who want to buy and the better we can work to ensure all residents have safe and secure homes.

    The data

    Homeownership rates ticked up in each of Greater Houston’s three counties in the pandemic’s immediate aftermath, but remain flat from a decade ago.

    There were over 2.5 million housing units in Houston’s three-county region in 2023, and more than 92% of them were occupied. This is four points higher than in 2010.

    In 2023, nearly 60% of occupied housing units in Houston’s three-county area were occupied by homeowners and 40% were occupied by renters.

    Fort Bend and Montgomery counties have consistently outpaced the state and nation in homeownership rates, while Harris County has consistently had the lowest rates across all geographies. In 2023, Fort Bend and Montgomery counties continued their trend of higher homeownership rates, at 77% and 69% respectively, compared to Harris County at 55%, the state at 63%, and the nation at 65%.

    Between 2010 and 2019, the homeownership rate dipped in each county in the Houston region, Texas, and the U.S. overall. In 2021, homeownership rates across all regions saw a modest increase driven by historically low interest rates combined with a growing trend of individuals relocating from urban areas. However, this trend stopped in 2023 in all geographies except Harris County, which saw a slight increase in homeownership rates between 2019 and 2023. As of 2023, homeownership rates have either decreased or remained flat compared to 2010.

    Homeownership rates declined 5 percentage points

    in Montgomery County between 2010 and 2023. The largest decline in the three-county region.

    Between 2010 and 2023, the number of occupied housing units in Houston’s three-county region increased by 35%, more than two times the national growth rate of 15%. The substantial increase in Houston-area rentals (41%) is the primary driver of the overall increase in occupied housing, though the number of housing units occupied by homeowners increased by 32% during this period as well.

    Fort Bend and Montgomery counties saw the largest increases in occupied housing overall, with upticks in both homeowners and renters. This is largely because their population growth outpaced the growth of Harris County, Texas, and the nation.

    Between 2010 and 2023, the number of households that rent has increased faster than households that own, which contributed to the decline in overall homeownership rates over the last decade. Between 2010 and 2023, renter-occupied households increased by 71% in Fort Bend, 35% in Harris, and 93% in Montgomery counties while owner-occupied households increased by 63% in Fort Bend County, 24% in Harris County, and 51% in Montgomery County.

    93% increase

    in renter households between 2010 and 2023 in Montgomery County.

    Over time, growth in occupied housing across the three counties, Texas, and the U.S. is typically attributed to the growth in renter-occupied housing which generally outpaces the growth in owner-occupied housing. This trend has been especially pronounced in Montgomery County.

    However, between 2019 and 2021, this pattern reversed, as historically low interest rates and the rise of remote work drove more people to buy homes. During this period, in the immediate aftermath of the pandemic — when the housing market grew at paces not seen in modern history — the number of units occupied by homeowners outpaced rental units, in some cases doubling and quadrupling.

    By 2023, the trend reversed because of rising interest rates and soaring housing prices. The growth in renters once more outpaced the growth in homeowners in most areas, except Harris County. Montgomery County saw the largest increase in renters at 34%.

    Homeownership by Race/Ethnicity

    There are racial and ethnic disparities in homeownership across Houston’s three-county area. The practice of redlining, combined with other discriminatory yet legal housing policies intent on racial exclusion, led to the systematic exclusion of Black households from homeownership for most of our nation’s history. Despite the Fair Housing Act of 1968, we continue to see the impacts of these practices today with Black households consistently having the lowest homeownership rates across all geographic areas and years.

    In the Houston three-county area, 72% of white households and Asian American households own their homes compared to 42% of Black and 55% of Hispanic households. In 2023, the homeownership rate for white households was 30 percentage points higher than Black households and 17 percentage points higher than Hispanic households in the region overall. These racial gaps in the three-county region have slightly decreased since 2010 when the homeownership rate gap was 26 points between white and Black households and 19 points between white and Hispanic households.

    This extreme homeownership disparity did not happen naturally. It is impossible to separate present-day homeownership rates from decades of racist, discriminatory housing policies that prevented Black, Indigenous, and other communities of color from owning homes in the past.

    It is impossible to separate present-day homeownership rates from decades of racist, discriminatory housing policies that prevented Black, Indigenous, and other communities of color from owning homes in the past.

    As we saw above, overall homeownership rates tend to be highest in Fort Bend and Montgomery counties and lowest in Harris County, and homeownership rates by race/ethnicity follow the same pattern: Rates for each race/ethnicity are highest in the outlying counties and lowest in Harris County. However, homeownership rates for Black and Hispanic households are consistently the lowest regardless of geography, revealing deeper disparities.

    Between 2010 and 2019 homeownership rates declined for three out of the four largest racial/ethnic groups in each Houston-area county. Comparatively, between 2019 and 2021, homeownership rates increased for all groups except Black households in Fort Bend County and Asian American households in Harris County. Between 2021 and 2023, the homeownership rates of white households declined. Although, during this same time Asian, Black, and Hispanic households saw a slight increase in homeownership rates across Harris County, Texas, and the United States. Rates for these three racial/ethnic groups decreased in Fort Bend and Montgomery counties.

    Even though homeownership rates for Black households in Harris County increased between 2021 and 2023, compared to a decrease for Black households in Fort Bend and Montgomery counties, in 2023 Black households in Harris County still have the lowest homeownership rate at 37%.

    Black households in Montgomery County saw the greatest decline in homeownership rates (12 percentage points) since 2010.

    In Fort Bend County, where homeownership is consistently highest in the region, the homeownership rate gap between white and Black households was 13 percentage points in 2023. This is the smallest gap in the region. The difference in homeownership rates between white and Black households for the same year was 29 points in Montgomery County and 32 points in Harris County. Compared to 2021, this disparity has decreased in Fort Bend and Harris counties by 3 and 2 percentage points respectively but it has increased in Montgomery County by 9 points.

    However, looking at a longer-term trend, racial/ethnic disparities in homeownership have not narrowed in the last decade — since 2010 this disparity has widened by nine points in Montgomery County, five points in Harris County, and two points in Fort Bend County. The gap also grew in Texas by two percentage points, but remained flat in the U.S.

    Nationally and locally, there is a marked decline in Black homeownership. Reasons for the decrease in Black homeownership include lack of affordable housing and lower access to credit. National research found Black residents were more than twice as likely to receive a subprime loan as white applicants.1

    Homeownership Decreased Across Most Income Groups

    One major obstacle to homeownership is having the means to afford a down payment and to maintain a mortgage, insurance, maintenance, utilities, and property taxes while balancing other expenses and debts. To illustrate the portion of households in need of housing assistance of some form, the Department of Housing and Urban Development (HUD) compiled Comprehensive Housing Affordability Strategy (CHAS) data, which provides counts of households that qualify for government housing assistance based on income. Households that make less than 80% of the HUD Area Median Family Income (HAMFI), begin to qualify for assistance at the local, state, and federal levels, though some programs are reserved for the lowest income households.

    The CHAS data shows the proportion of homeowners by income group. Low-income families in Harris County are consistently the least likely to own their homes compared to the region, state, and nation. For example, 30% of households with 30% HAMFI or less were homeowners in Harris County, compared to 38% in Texas, and 36% in the U.S., according to HUD’s analysis of five-year estimates ending in 2021 from the American Community Survey.

    Fort Bend County and Montgomery County see a different pattern. Low-income families in Fort Bend and Montgomery counties are more likely to own their home than their counterparts in Harris County and are higher than the state and national averages. Among households with 30% HAMFI or less, 49% in Fort Bend County and 55% in Montgomery County were homeowners, compared to 30% in Harris County.

    Between 2010 and 2021 homeownership rates decreased across all income groups except for households with incomes of 30% or less of HAMFI. In Harris and Montgomery counties, the state, and the nation, homeownership rates actually ticked up for households earning 30% HAMFI. Fort Bend County was the only area to see a decrease in the percentage of 30% or less HAMFI households who are homeowners, dropping by 7 percentage points during the same period.

    Houston-area home values have risen faster than the nation.

    Houston has a reputation for being affordable, especially compared to other metropolitan areas. But recent trends have put that reputation at risk as housing prices in the Greater Houston real estate market have increasingly outpaced incomes.

    Those wondering, “is now a good time to buy a house in Houston?” will find that the answer is never a simple yes or no. In 2023 the median home value in the U.S. was $340,200 The median home value in Harris County was $287,100, which was just below the state median value of $296,900. However, the median home values in Fort Bend and Montgomery counties — at $384,100 and $359,800, respectively — were well above the national median value.

    Between 2010 and 2023, median home values increased by 35% across the nation compared with 66% in Texas. Despite this faster growth, the median home value in Texas is consistently lower than in the U.S. Locally, the median home value rose 56% in Fort Bend County, 55% in Harris County, and 61% in Montgomery County between 2010 and 2023.

    The House Price Index in the Houston area has risen fastest in Harris County

    The Federal Housing Finance Agency House Price Index (HPI) measures average price changes in repeat sales or refinancing on the same properties and serves as a timely indicator of house price trends. It provides a way to compare single-family house prices across different geographic regions that controls for distortions in the market.

    In 2023, the HPI was highest in Harris County among Houston’s three counties and 17% higher than in Fort Bend and 25% higher than in Montgomery counties. Although median housing values are higher in Fort Bend and Montgomery counties compared to Harris County and the nation, the relative lower HPI indicates lower average housing prices in repeat sales or refinancing.

    The index trends in Houston’s three-county region and Texas generally follow the national trend, but the national HPI surpassed our region just before the 2008 housing crisis, signaling that housing prices at the national level were rising faster than in our region. However, the Houston region eventually caught up: between 2010 and 2023, the HPI increased 128% across Texas, 115% in Montgomery County, 116% in Fort Bend County, 98% in Harris County, and 99% in the nation. More recently, between 2020 and 2023 alone, HPI increased 42% across the state, 40% nationally, 43% in Montgomery County, 43% in Fort Bend County, and 27% in Harris County.

    Houston-area housing costs have increased for renters but declined for homeowners since 2010

    Is rent expensive in Houston? While rent is still less expensive than the average housing payment with a mortgage, rents in Houston’s three-county area are higher than the national and state averages. Gross rent is the contract rent plus the estimated average monthly cost of utilities.

    Median gross rents in the region were higher in 2023 than in 2010. They climbed fastest between 2010 and 2019 and then were relatively flat between 2019 and 2021 (except in Fort Bend County where median rents fell about 10 percent). The cost of rent then increased once again in 2023, compared to 2021, across all geographies.

    Overall, among Houston’s three counties, Fort Bend had the highest median gross rent, growing 21% to $1,839 in 2023 from $1,516 in 2010. The median gross rent in Harris County increased to $1,403 from $1,165, up 20% since 2010. During the same time period, median gross rent in Montgomery County rose 28% to $1,508 in 2023 from $1,179 in 2010. For comparison, gross rent rose 26% for the average Texan and 18% for the average American during this time period. As rents increase, opportunities to save for homeownership become more difficult.

    Additionally, median housing costs for homeowners across the three-county area are higher than the national and state average. These cost estimates include the total sum of payments made for mortgages, real estate taxes, insurance, utilities and fees.

    Interact with the chart to explore differences in households with a mortgage and ones without.

    In 2023, the median monthly housing cost for the average homeowner in Houston’s three-county region was lower than it was in 2010 (except in Montgomery County where costs increased less than 1%).  Compared to increasing rents, the median monthly housing cost for homeowners decreased by 10% in Fort Bend County, 12% in Harris County, 3% across Texas, and 15% across the country between 2010 and 2023.

    Homeowners with a mortgage in Fort Bend County pay about $2,600 a month on housing — $700 more than the national average.

    More than half of Houston-area renters are burdened by housing costs

    How is housing affordability defined? The U.S. Department of Housing and Urban Development considers affordable housing as not more than 30% of income. If a household spends 30% or more of their income on housing costs, they are considered to be housing cost-burdened. Households that are severely cost-burdened spend 50% or more of their income on housing costs. These thresholds, established in the 1980s by the federal government, indicate when housing is considered affordable.

    Renters are more likely to be burdened (spending 30% or more on housing) by housing costs than homeowners. While this has been true for at least a decade, this trend has worsened in recent years — particularly for the most vulnerable residents.

    The total number of housing cost-burdened owner households in 2023 compared to 2010 was 13% lower in the U.S., 18% higher in Texas, 12% higher across the three-county region, 29% higher in Fort Bend, 6% higher in Harris, and 37% higher in Montgomery.

    Comparatively, the number of housing cost-burdened renter households increased 13% in the U.S., 42% in Texas, 54% overall in the region, 127% in Fort Bend, 48% in Harris, and 131% in Montgomery County.

    As of 2023 Fort Bend County leads the region with the highest rate of renters facing housing cost burdens—a spot historically held by Harris County. This shift is driven by a significant 12-percentage-point increase in just two years between 2021 and 2023. In comparison, Harris County saw a modest 1-point increase during this time while Montgomery County saw a 6-point rise.

    57% of Fort Bend County renters are housing cost-burdened.

    Homeowners were struggling with housing costs in 2010. It was the time just after the worst of the Great Recession, and 29% of homeowners in Houston’s three-county region were spending 30% or more of their income on housing. Over time, the situation improved for some of those who were able to keep their homes, and by 2019, the proportion of homeowners that were cost-burdened had fallen to 20%. Before the arrival of COVID in Houston, these households were in much better financial shape, including having built home equity, which provided a buffer to the worst of the economic effects. In 2023, the proportion of homeowners that were cost-burdened ticked up only 4 percentage points to 24%.

    But households that rented most likely had a different experience. Back in 2010, 47% of households that rented in Houston’s three-county region were burdened by the amount spent on housing — that’s nearly one in two renter households. By 2019, that hadn’t changed. Because these households were just as burdened by housing costs nearly a decade later, they were still in tough financial shape heading into the worst global public health crisis in a century. And after the first year of the pandemic, one in two renter households in 2021 were burdened by the amount they spent on housing and in 2023 the percentage of cost-burdened renters continued to increase with 52%, over half, of renters spending 30% or more of their income just on the cost of housing. However, there are differences by county — the proportion of households that are cost-burdened in Fort Bend County is 57%, in Harris County 52%, and Montgomery County 46%.

    830,000 households

    In the three-county region spend 30% or more of their income on housing. Of which 41% are homeowners and 59% are renters.

    Essentially, homeowner households are now less likely to be cost-burdened compared to 2010, while renters are more likely to be cost-burdened.

    Households that are severely cost-burdened spend 50% or more of their income on housing costs. According to the National Low Income Housing Coalition, severely cost-burdened renter households are more likely than other renters to sacrifice necessities like healthy food and health care to pay the rent and are more likely to experience unstable housing situations and evictions. These are the most vulnerable among vulnerable households, and housing costs for this group have only become more burdensome.

    Renters are more likely to be severely cost-burdened than homeowners. About 27% of renter households in Greater Houston were severely housing cost-burdened in 2023 similar to 24% statewide and 25% nationally but more than double the rate for homeowners. About 11% of homeowners in the Houston three-county area were severely housing cost-burdened in 2023 about one percentage point higher than the state and national averages.

    Similar to housing cost burdened households, Harris County has typically had the highest rate of renters who are severely housing cost burdened. However, as of 2023, Fort Bend County has the highest rate of renters in the three-county region who are spending 50% or more of their income on housing. Fort Bend County saw the rate of severely housing cost burdened renters increase by 8 percentage points between 2021 and 2023 compared to rates stagnating in Harris County and increasing by 4 points in Montgomery County.

    30% of Fort Bend County renters are severely housing cost-burdened.

    The proportion of renters that are severely cost-burdened is 22% in Fort Bend, 26% in Harris, and 19% in Montgomery County, whereas the proportion of homeowners who are severely cost-burdened is 12% in Fort Bend, 10% in Harris, and 9% in Montgomery County.

    400,000 households

    In the three-county region spend more than half their income on housing. Of which 37% are homeowners and 63% are renters.

    As we saw earlier, between 2010 and 2021, the proportion of renters spending 30% or more of their income on housing grew faster than that of homeowners. The same trends holds true for renters spending 50% or more of their income on housing, outpacing the increase seen among homeowners.

    The total number of severely housing cost-burdened owner households in 2023 compared to 2010 was 6% lower in the U.S., 31% higher in Texas, 23% higher across the three-county region, 54% higher in Fort Bend, 13% higher in Harris, and 54% higher in Montgomery.

    Comparatively, the number of severely housing cost-burdened renter households increased 12% in the U.S., 41% in Texas, 60% overall in the region, 161% in Fort Bend, 49% in Harris, and 169% in Montgomery County.

    Housing Cost Burdened by Income

    Income plays a crucial role in understanding the impact of being housing cost burdened. Households with higher incomes, even when spending 30% or more of their income on housing, are likely to have greater financial flexibility to manage other essentials like healthcare, food and transportation. In contrast, lower-income households that are housing cost burdened face much tighter budgets. With more of their limited income consumed by housing, they often struggle to cover basic needs, increasing their risk of debt, eviction, and financial instability. The financial strain is far more significant for those with lower incomes, making housing affordability a more critical issue for them.

    Across all regions, very low-income households (those earning less than or equal to 30% of the HUD Area Median Family Income) face the highest levels of housing cost burden with around 3 out of 4 very low-income households in the Houston 3-county region being housing cost burdened compared to 1 out of 17 households earning more than 100% of the HUD Area Median Family Income (HAMFI).

    We see the same trend for households who are severely cost burdened with 2 out of 3 very low-income households in the Houston 3-county region spending at least 50% of their income on housing compared to less than 1% of households that earn more than 100% of the HAMFI.

    More than one out of every two dollars in income goes to housing and transportation costs in Fort Bend and Montgomery counties

    Just as there is more to the cost of living in Houston, there is more to housing affordability than mortgage, rent or utilities. For most households in the United States, housing and transportation represent the largest and second-largest expenditures, respectively. The Housing and Transportation (H+T®) Affordability Index estimates the percentage of a household’s income that will be spent on housing and transportation costs in a given location, which can help people make better-informed decisions about where to live and work. Here we show the cost burden of the combined expenses in each county.

    Fort Bend residents spend a higher share of their income on housing and transportation than the other Houston-area counties and compared to other populous counties in the state, except for El Paso. Fort Bend County residents spent approximately 54% of household income on combined housing and transportation costs in 2022, compared to 50% of household income for residents in Montgomery County and 43% of household income for residents in Harris County. The percentage of income spent on housing and transportation costs in Fort Bend and Montgomery counties is higher than the H+T cost-burden threshold of 45%, driven primarily by exorbitant transportation costs.

    Fort Bend County residents also spend a larger share of their income on housing and transportation than residents of Cook County, Illinois (Chicago), Fulton County, GA (Atlanta), and Los Angeles County, which is infamous for its expensive housing market and congested freeways.

    More Helpful Articles by Understanding Houston:

    Resources

    References:

    1. Faber, J. W. (2013). Racial Dynamics of Subprime Mortgage Lending at the Peak. Housing Policy Debate, 23(2), 328–349. https://doi.org/10.1080/10511482.2013.771788
  • Housing

    Housing

    Understanding Housing in Houston

    Access to affordable and safe housing is critical to the health, quality of life, and well-being of all residents.

    Hundreds of thousands of Houston-area residents face housing insecurities and vulnerabilities. Many of our neighbors are burdened by housing costs and economic insecurity, and they have been negatively impacted by multiple devastating disasters.

    The cost of housing in Houston’s three-county region has soared in recent years – especially for renters. Households burdened by housing costs typically have lower access to resources to navigate through and recover from external crises and threats such as weather-related disasters or economic shocks, which can often lead to housing damage, overcrowding, eviction, and homelessness. As a result, homeownership rates remain flat from a decade ago and has become increasingly unaffordable for would-be first-time homebuyers. Moreover, racial/ethnic disparities in homeownership across Houston’s three-county area have worsened in the last decade. This is problematic because homeownership remains a critical pathway to building wealth — the kind that is financially compounded and passed to future generations — among the main drivers of our nation’s massive wealth gap.

    The more we understand affordable, safe, and stable housing as a basic need, the more we can do to ensure quality housing options are available for people across our region to keep our communities healthy and vibrant.

  • Health Risks & Outcomes

    Health Risks & Outcomes

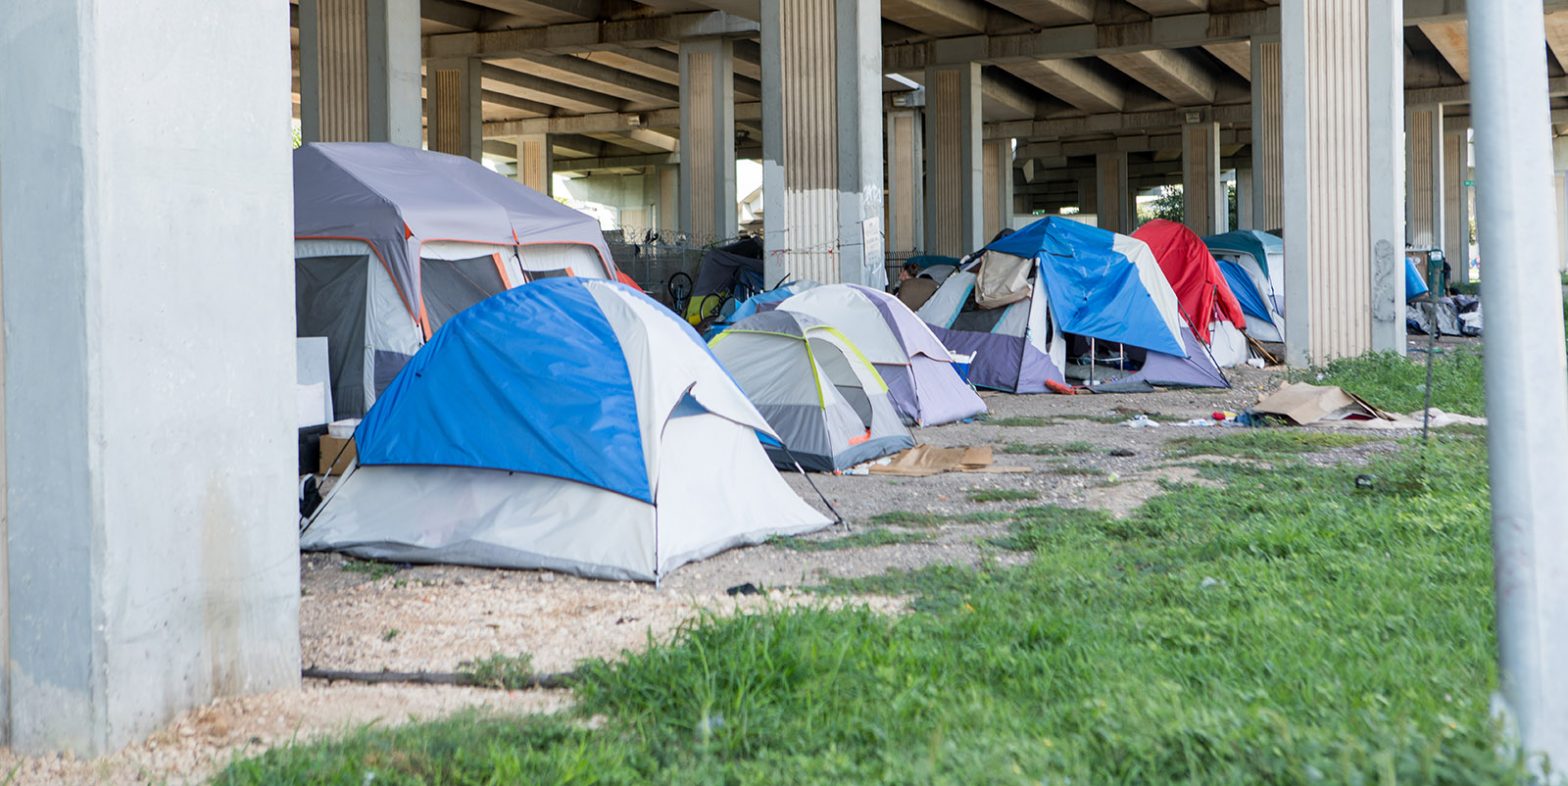
    Health Risks & Health Outcomes in Houston

    While cancer mortality rates have declined and residents in the Houston three-county region are more physically active, other important indicators of overall health and wellbeing have declined

    Slightly fewer Houstonians are sedentary and the rate of individuals dying from cancer is our region is increasing; however, food insecurity continues to rise while self-rated health falls. Additionally, life expectancy in the Houston region has slightly decreased while rates of premature death rise. These outcomes ultimately lead to a decline in quality of life and contribute to the most common causes of death.

    Why health risks and health outcomes matter to Houston

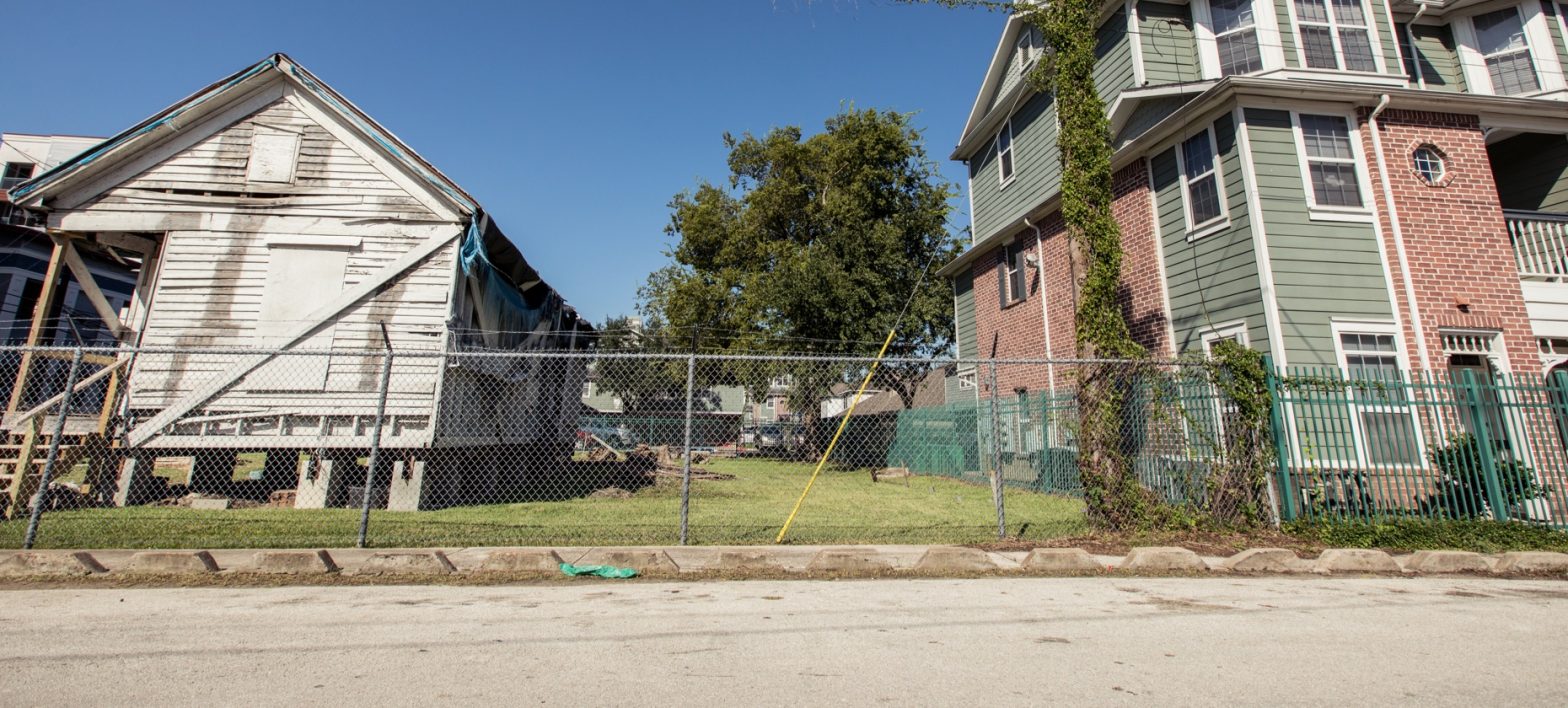
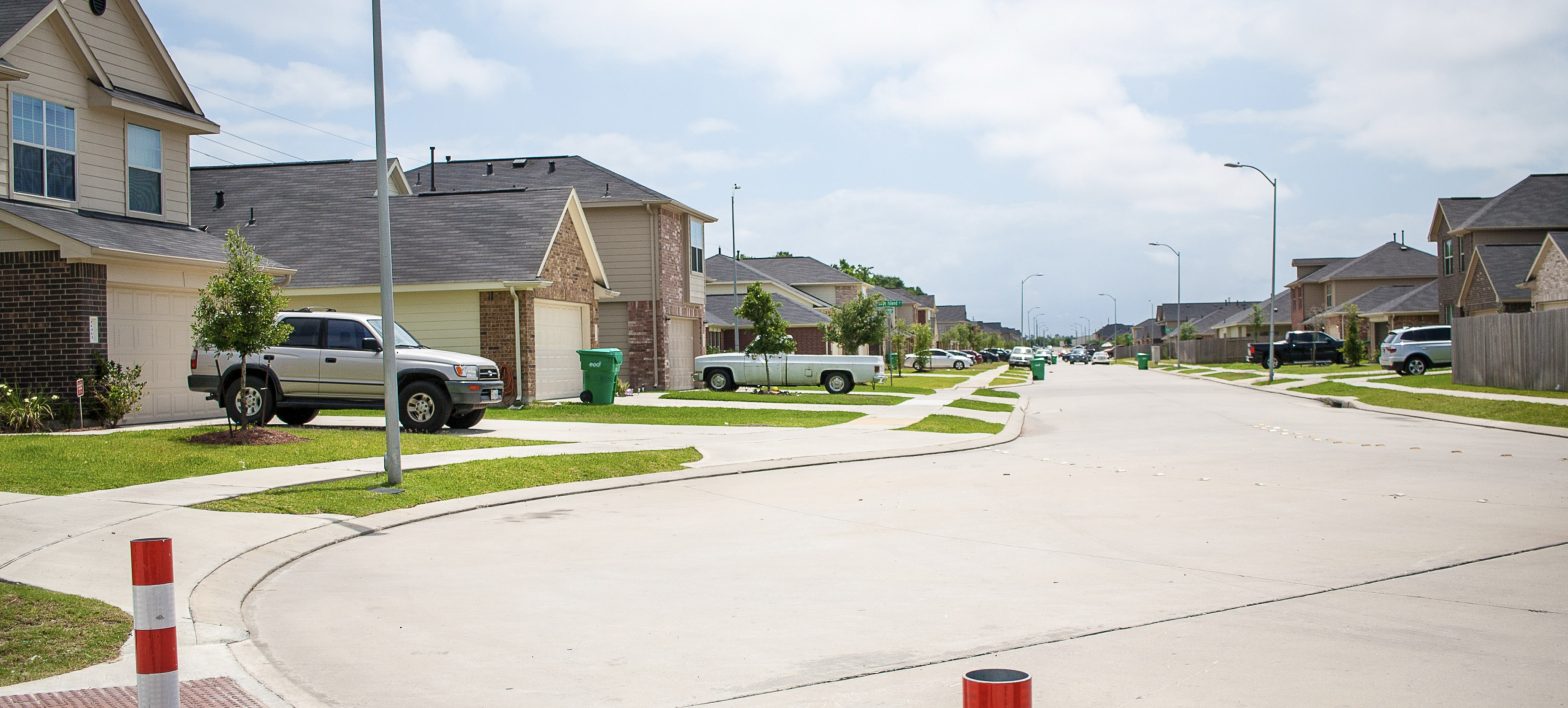
    What determines health outcomes? Broadly, the Non-Medical Drivers of Health (NMDOH) are the myriad everyday conditions that affect our health, functioning, and quality of life. Income, education, employment, the neighborhoods in which we live, and whether our housing is safe and affordable are among the most well-known factors influencing our overall health. In addition, our health is affected by elements of our environment, including the extent to which we are exposed to life-threatening toxins in our air or water, our ability to access affordable, healthy foods, and the strength of social support networks. Established research has found that these factors have a substantial effect on our health and well-being.1 Between one-third and one-half of all health outcomes are influenced by the social determinants of health — a greater effect than health care or lifestyle, according to the World Health Organization (WHO).

    Because NMDOH have such a significant effect on health outcomes, they are also responsible for most health disparities, which the WHO defines as the “unfair and avoidable differences in health status.” These health disparities are most prominent when comparing neighborhood to neighborhood and race/ethnicity. This is because place-based inequality remains inextricable from racial inequality — the result, in part, of residential segregation, economic exclusion and uneven investment that has shaped the life of most Black communities and other communities of color in the U.S.2 Unequal social, economic, built and physical conditions within and across neighborhoods and race/ethnicity can reduce opportunities for healthy outcomes, which explains racial health disparities, according to the Robert Wood Johnson Foundation.

    The more we directly address NMDOH for Houston-area residents, the more we can improve their overall health and reduce the disparities we see by race/ethnicity, place, and income level.

    The data

    Residents in Fort Bend and Montgomery counties report more physical activity than Harris County residents

    activity can increase the risk for diseases, including cardiovascular diseases, diabetes and obesity, hypertension, cancer, depression, and anxiety.3 In addition, physical inactivity is associated with reduced expenditures on health care treatments for circulatory system diseases.4

    Rates of physical inactivity overall have been in decline. In 2019 about 26% of adults across the U.S. reported no physical activity decreasing to 23% in 2021. This rate is slightly higher across Texas with 25% of adults reporting no physical activity. In the three-county Houston region, Harris County sees the highest rate of residents who are not regularly physically active at 28% compared to Fort Bend County (23%) and Montgomery County (22%). Montgomery County has seen the biggest decline in the percent of physically inactive adults going from 28% in 2019 to 22% in 2021.

    Research shows that trends in physical activity correlate strongly with income and education level, a finding consistent with Texas trends as well.5 On average, those with lower household incomes and lower levels of educational attainment were more likely to be physically inactive.6 Research from the Robert Wood Johnson Foundation suggests this is because people with more education tend to have higher paying jobs, which allows them the option to live in neighborhoods that have lower crime rates and greater access to recreational facilities. Additionally, people with high levels of educational attainment are more likely to work one job only, which affords them more time for recreational activities.

    Because of the high correlation between race and income/education, it is not surprising that Black and Hispanic adults in Texas are more likely to be physically inactive than white adults, according to Behavioral Risk Factor Surveillance System (BRFSS) data from the Texas Department of State Health Services; in 2023, about 79% of white Texans engaged in recreational physical activity compared to 73% of Black and 67% of Latino Texans. Additionally, women in Texas are more likely to be physically inactive than men by 7. percentage points.

    Prior to the pandemic, food insecurity in the Houston region was in decline

    The U.S. Department of Agriculture (USDA) defines food insecurity as a lack of consistent access to adequate food for a healthy life. In 2023, more than one in 10 Americans were food insecure (13.5%). That is equivalent to about 47.4 million people, including more than 13 million children. Food insecurity is most common amongst people living below the poverty line, people of color, single adults and single-parent households. Although food insecurity is closely related to poverty, people living above the poverty line also experience food insecurity.

    Feeding America provides estimates for food insecurity at different community levels. Using the relationship between food insecurity and its closely linked indicators (poverty, unemployment, homeownership, disability prevalence, etc.) an estimated food insecurity rate is generated.

    According to Feeding America, the food insecurity rate declined in Houston’s three-county area between 2017 and 2019. However, the effects of COVID-19 in Houston led to an increase in the estimated food insecurity rate in 2020. In 2021, food insecurity rates slightly declined likely in part due to increased benefits and greater flexibility in assistance programs during the pandemic. In fact, in 2021, national food insecurity rates reached a two-decade low. However, food insecurity rates then increased in both 2022 and 2023 due to the termination of pandemic-related assistance. Feeding America estimates that food insecurity is highest in Harris County and lowest in Fort Bend County, and Texas has a higher rate than the national average. It is important to note that in the U.S., children are more vulnerable to food insecurities, 17.9% compared to 12.9% for all individuals.

    Given that this data is based on proxy indicators, it is very likely that the rate of food insecurity is undercounted. A 2024 study conducted by Kinder Institute for Urban Research estimates that about 39% of households in Houston and Harris County are food insecure.

    Houston region residents’ physical health has worsened since 2020

    How one rates their own health is a reliable indicator of a person’s overall physical state and well-being and has been found to be a strong indicator of mortality.7 People who rate their health as “poor” had twice the mortality risk, compared with those with “excellent” self-rated health.8 This measure is also found to be closely correlated with the results of physical exams by health providers.9

    Harris County had the highest proportion of adults who rated their current state of health as “fair” or “poor,” at 25% in 2022, compared to 16% in Fort Bend County and 20% in Montgomery County. The percentage of adults in Harris County who considered themselves to be in poor or fair health was also higher than the state, which was higher than the national average. While self-reported rates of “fair” or “poor” health decreased in 2020 they began to increase starting in 2021. Between 2020 and 2022, the percent of residents reporting “fair” or “poor” health grew by 7 percentage points in Harris County, 6 points in Montgomery County, and 3 points in Fort Bend County.

    Another way to predict healthy outcomes and measure health-related quality of life is the average number of physically unhealthy days in the past 30 days, which shows how people rate their recent health. A study on the number of healthy days reported in a county found that counties with more unhealthy days were likely to have higher unemployment, poverty, percentage of adults who did not complete high school, mortality rates, and prevalence of disability than counties with fewer unhealthy days.10

    This indicator’s trend over time is similar to the self-rated health indicator decreasing in 2020 and then increasing in 2021 and 2022.

    Residents in Fort Bend County (3.4) reported fewer physically unhealthy days than both the state (3.8) and nation (3.9), whereas Harris County reported the most unhealthy days (4.3) with the average number of physically unhealth days experienced by Harris County residents increasing by nearly one day between 2021 and 2022.

    At least one-third of adults in the Houston three-county region are living with obesity

    Obesity, defined as having a body mass index (BMI) of 30 or more, is a complex health condition affecting both adults and children. Obesity increases the risk for health conditions such as coronary heart disease, type 2 diabetes, cancer, hypertension, and more.

    Among all the “modifiable” behavioral risk factors, obesity is found to take more years of life than diabetes, tobacco use, hypertension or high cholesterol. Obesity also has significant economic consequences. On average, adults with obesity spend $3,429 more per person annually on medical expenses than those with medically healthy weights.11

    Among all the “modifiable” behavioral risk factors, obesity is found to take more years of life than diabetes, tobacco use, hypertension or high cholesterol.

    Since at least the late 1990’s, obesity rates have generally trended upward. In 1996, in Texas and across the country, about 17% of adults 18 years and older were living with obesity. As of 2023, that rate sits at about 34%. The nine-county Houston metropolitan area has seen similar trends since the early 2000s (the earliest data available) with obesity rates sitting at 23% in 2002 and increasing to 31% as of 2023.

    If we look closer at the Houston three-county region, we see that Harris and Montgomery counties have slightly higher obesity rates compared to Fort Bend County and the nation. Although at least one-third of all adults in each county are living with obesity. In Montgomery County, about 36% of adults 18 years and older are living with obesity. That rate is 35% in Harris County and 34% in Fort Bend County. For Montgomery and Harris counties, these rates are very similar to what they were in 2018. In Fort Bend County, obesity rates increased by about 5 percentage points between 2018 and 2022.

    Adults who are between the ages of 18 and 29 have the lowest obesity rates, but one in four was still considered obese in 2022. However, this is a decrease of 12 percentage points from 2016 when the rate was around 37%. Residents 65 years and older in Harris County have the second lowest rates of obesity at 27%. Adults 30-44 now have the highest rates of obesity in Harris County at 38%, an increase of about 7 percentage points from 2016, followed closely by adults 45-64 at 36%, an increase of about 5 percentage points since 2016.

    Obesity in Harris County tends to be more prevalent among individuals with less education. About 37% of individuals with a high school diploma only are living with obesity compared to 29% of Harris County residents with some college education. Historically, adults with a college degree had lower obesity rates than those with some college but no degree. However, this pattern shifted around 2021. As of 2022, individuals with a college degree have obesity rates at about 33% — higher than rates for those with some college but no degree.

    In terms of income, 43% of adults in Harris County who earn less than $25,000 annually are living with obesity compared to about 28% of adults earning $50,000 or more annually.

    Nearly half of adults in Harris County who earn less than $25,000 annually are obese

    And, consistent with national trends, obesity rates are highest among Black and Hispanic/Latino adults in Harris County (40% and 36%, respectively). However, nearly one in four white adults also experienced obesity in 2022.

    Between 2016 and 2022, obesity rates remained the same for Hispanic/Latino and white adults in Harris County while there was a decrease of nearly 8 percentage points for Black adults.

    The prevalence of diabetes in the Houston region has continued to tick up

    Diabetes is the seventh leading cause of death in America, accounting for nearly 70,000 or 4% of total deaths in 2023. About 1 out of 10 Americans (38 million people) have diabetes, and 90-95% of them are diagnosed with type 2 diabetes, according to the Centers for Disease Control and Prevention (CDC). An additional 98 million U.S. adults are pre-diabetic — where blood sugar levels are higher than normal, but not high enough yet to be diagnosed as type 2 diabetes — and over 80% are not aware they are headed toward a full diabetes diagnosis. The total medical costs and lost work and wages for people with diagnosed diabetes was estimated at around $413 billion yearly.

    The percentage of adults in Texas with diabetes has increased by 2 percentage points from 10% in 2011 to 12% in 2023. The percentage of adults with diabetes in Texas is consistently higher than the national rate, which stood at 9% in 2023 — a slight increase compared to 8% in 2011.

    The percentage of adults aged 20 and older with diagnosed diabetes in the Houston region is in the top quartile of the state. In 2023, the percent of adults 20 years and older with diabetes sat at around 11% for all three counties in the region — either flat or slightly increased compared to 2011.

    Cancer mortality and incidence rates in Houston’s three-county region have declined

    In 2023, over 600,000 people in the U.S. died of cancer, making it the second leading cause of death in the nation. In 2022, the latest year for which incidence data are available, 1.8 million new cases of cancer were reported in the United States. Fortunately, over time there has been a decrease in the rates of deaths caused by cancer and new cancer incidence rates. According to the CDC, the rate of cancer deaths across the U.S. has decreased by 14% and the rate of new cancers decreased by 4%.

    Cancer mortality rates have fallen in Houston’s three-county region. Since 2010, Harris and Montgomery counties have had cancer mortality rates close to one another and about on par with the state. Fort Bend County has consistently had the lowest rates of cancer mortality in the region.

    Additionally, since 2010, Fort Bend County has seen the largest drop in its cancer mortality rate falling by 23% between 2010 and 2022. Harris and Montgomery counties also experienced a decline over the same time at 19% and 13% respectively. At 111 deaths per 100,000, Fort Bend’s cancer mortality rate is already below the Healthy People 2030 target of 122.7 deaths per 100,000.

    At 111 deaths per 100,000, Fort Bend’s cancer mortality rate is already below the Healthy People 2030 target of 122.7 deaths per 100,000.

    Risk of cancer and cancer mortality is affected by many behaviors, diseases, and genetic factors. It is also influenced by health disparities in socioeconomic status and access to care. These various drivers of cancer mortality is why we see disparities in cancer mortality by certain demographic characteristics.

    Across Texas and throughout the three-county Houston region, Black residents experienced the highest cancer mortality rates among the four largest racial/ethnic groups in both 2010 and 2022, and men had higher rates than women. However, mirroring trends we’re seeing for the overall population, cancer mortality declined for most demographics during this time period between 2010 and 2022. However, cancer mortality did increase among Asian residents in Fort Bend and Harris counties.

    In a similar fashion, new cancer incidence rates in the three-county area have also seen decreases over time. Between 2010 and 2022, rates of new cancer decreased between 8-9% in Fort Bend, Harris, and Montgomery counties compared to a 2% decline across Texas. As of 2022, Texas has the highest rates of new cancer incidents at 427 followed closely by Montgomery County at 424. In Harris County in 2022, there were 409 cancer case reported for every 100,000 residents and that rate was 383 in Fort Bend County during the same year.

    Cancer clusters

    A “cancer cluster” refers to a greater than expected number of cancer cases that occur within a group of people in a geographic area over a defined period of time, according to the CDC. In 2019, the Texas Department of State Health Services (DSHS) identified a cluster of lung and throat cancers among adults between 2000 and 2016 in the communities of Fifth Ward and Kashmere Gardens in North East Houston. In an analysis one year later, an additional cancer cluster was found in the same neighborhoods when children were diagnosed with leukemia at five times the state rate during the same time period. A study conducted by the U.S. Environmental Protection Agency (EPA) found that dioxins, a highly toxic cancer-causing compound, were present in soil around these communities. The EPA has developed a website to provide ongoing information on actions being taken to address this soil contamination.

    Life spans in the Houston region slightly decline

    Life expectancy is a reflection of the mortality patterns of a population and is a common measure used to describe overall public health across different communities. It refers to the average number of years one person can expect to live (from a specified age) based on the age-specific mortality rates of the population.

    Across the country, life expectancy from birth has increased by decades over the past 120 years. The greatest improvements occurred in the first half of the 20th century. Since then, life expectancy has steadily and consistently increased, though at a slower rate. Until the COVID-19 pandemic.

    Life expectancy in the U.S. fell to 77.0 years in 2020 from 78.8 in 2019. This reduction of 1.8 years of life was the largest single-year decline in more than 75 years. In addition to COVID-19, the decline was also attributed to the increase in deaths from unintentional injuries, heart disease, homicide, and diabetes.

    Life expectancy in the U.S. fell to 77.0 years in 2020 from 78.8 in 2019. This reduction of 1.8 years of life is the largest single-year decline in more than 75 years.

    Additionally, U.S. life expectancy fell from 77.0 in 2020 to 76.4 in 2021, then recovered to  78.4 by 2023 — nearly matching pre-pandemic levels of 78.8 in 2019.

    While life expectancy has grown for both Black and white Americans, a gap between the two groups remains. In 1900, the gap was nearly 15 years, but that has narrowed to 4.5 years in 2023.

    What are life spans like for the population in Houston? Overall, residents in Houston’s three-county area live slightly longer than the state average (76.7). Across the three counties, the life expectancy for residents of Fort Bend County (81.4) is higher than that of Harris (77.9) and Montgomery (78.6) counties. Similar to national trends, Texas and the Houston region did also see decreases in life expectancy during the COVID-19 pandemic with the largest decrease of 1.7 years of life happening across the state of Texas.

    Disparities in life expectancy among race/ethnicity continue in the Houston three-county region and they have widened over time. During the 2016-18 years, the life expectancy gap between white and Black residents in Fort Bend and Montgomery counties was about 1 year. As of the 2021-23 years it has risen to over 2 years with white residents expected to live about 2.5 years longer than Black residents. In Harris County, where this disparity is widest it increased from 4.3 years to 4.9 years between 2016-18 to 2021-23.

    How long we live depends on a variety of interrelated factors, including genetics, access to high-quality medical care, and quality of nutrition. More significantly, however, is the fact that established research has found direct links among health, economic opportunity, race, and place, both nationally and locally.12 Put another way, differences in life expectancy are closely related to socioeconomic opportunity, which is why we see disparities in life span across race/ethnicity, income level, and place.

    White residents in Harris County live an average of nearly five years more than Black residents.

    It is also worth noting that Hispanic residents in the region average longer lifespans than white residents by three to six years, despite the fact that Hispanics tend to have greater economic insecurity and uninsured rates, a national phenomenon known as the “Hispanic paradox” or the “Latino Mortality Advantage.”13 While more research is necessary, research suggests the counter-intuitive outcome can be attributed to lower smoking rates, family structure and strong social networks among Latinos.14 However, some research also suggests this advantage could disappear as the prevalence of obesity and diabetes increases among Latinos.15

    And we may already begin to be seeing this happen given that the life expectancy gap between Hispanic and white residents has begun to shrink mostly driven by a decrease in life expectancy for the Hispanic population. The life expectancy for Hispanic residents in the Houston region decreased by about 5 years between 2016-18 and 2021-23. In comparison, the life expectancy for white residents decreased by about 2 years.

    Comparing life expectancy to income reveals the extent to which higher income is associated with greater longevity. Nationally, research has shown that the richest men live 15 years longer than the poorest men, while the gaps in lifespan between the richest women and the poorest women is 10 years.16

    Further, life expectancies vary depending on where one lives within the three-county area — by as much as 23.4 years. Residents in a high-poverty East Houston neighborhood have the lowest life expectancy in the three-county area (65.7 years). On the other side of the spectrum, a wealthy neighborhood in the Clear Lake area near Bay Oaks Country Club has the longest life span of 89.1 years. This gap between low-income areas and their high-income counterparts is almost equivalent to the difference between low-income developing countries and high-income developed countries.

    Continue reading about health in Houston, including mental health and access to health care

    Life expectancy varies depending on where one lives within the three-county area — by as much as 23 years.

    Total deaths in the Houston region have decreased in recent years but remain about pre-pandemic levels

    There were more than 3.0 million deaths in the U.S. in 2023, a decrease of nearly 200,000 from 2022. The death rate (age-adjusted), which measures the number of deaths per 100,000 people, decreased for all age groups 5 years and older — the death rates for children under 5 did not significantly change from 2022 to 2023.

    The rate of total deaths in the Houston region mirrors what we see at the national level with a decrease in 2020 and 2021 and then decreases throughout 2022 and 2023. However, the number of deaths that occurred in 2023 is still higher than the number of deaths that occurred pre-pandemic in 2019. The number of annual deaths in 2023 compared to 2019 is 27% higher in Fort Bend County, 21% higher in Montgomery County, and 13% higher in Harris County.

    The Houston region’s premature death rates increase

    Premature death measures deaths among those under age 75 per 100,000 population. Deaths at younger ages contribute more to the premature mortality rate than deaths closer to age 75.

    According to the CDC, the leading causes of premature death that occurred before the age of 80 in the United States between 2010 and 2022 were  heart disease, cancer, unintentional injury, chronic lower respiratory disease, and stroke. Non-Medical drivers such as poverty, lower educational attainment and social isolation contribute to premature death.17 Populations at high risk for premature death include people with obesity or diabetes, individuals who drink excessively or smoke, and those who face occupational and environmental hazards.18 Many of these premature deaths may be preventable by changing lifestyles, maintaining healthy behaviors, and increased access to health care.

    Overall, the rate of premature deaths in the Houston region increased between 2016-18 and 2021-23—19% in Fort Bend County, 22% in Harris County, and 14% in Montgomery County. The premature death rate has also increased for all racial/ethnic groups with Hispanic residents in each county experiencing the largest increase between 2016-18 and 2021-23 increasing by 32% in Fort Bend County, 41% in Harris County, and 25% in Montgomery County. Fort Bend County has the lowest premature death rate in the three-county region (261 premature deaths per 100,000 residents) while Harris County has the highest (347 deaths per 100,000 residents). Across all three counties, Black residents experience the highest rate of premature deaths.

    Heart disease and cancer cause nearly half of all deaths in the region and nation

    In 2023, the top 10 leading causes of death in the U.S. were heart disease, cancer, chronic lower respiratory diseases, stroke, accidents (unintentional injuries), Alzheimer’s disease, diabetes, influenza and pneumonia, kidney disease, and suicide. Cumulatively, these diseases accounted for 60% of all deaths.

    The top 10 leading causes of death in Texas are slightly different from the nation as a whole. While heart disease and cancer   were the top two leading causes of death in both the U.S. and Texas in 2023, the remaining causes of death in Texas varied slightly. Accidents (unintentional injuries), stroke, Alzheimer’s disease, chronic lower respiratory diseases, diabetes, liver disease, kidney disease, and suicide make up the remainder of the top 10 list in 2023 for Texas in descending order.

    What are the most significant health issues in Houston? In 2023, the top 10 leading causes of death in the Houston three-county area were heart disease (21%), cancer (20%), accidents (8%), stroke (5%), Alzheimer disease (3%), chronic lower respiratory diseases (3%), diabetes (3%), kidney disease (2%), liver disease (2%), and blood infections (2%). There are slight differences by county.

    Suicide is the 11th leading causes of death in the Houston three-county region. In 2023, 2% of deaths in all three counties were the result of suicide — double what we see at the national level.

    Helpful Articles by Understanding Houston:

    Resources

    References:

    1. Link, B. G., & Phelan, J. (1995). Social conditions as fundamental causes of disease. Journal of health and social behavior, 80-94.
    2. Habans, R., Losh, J, Weinstein, R., and Teller, A. ( 2020). Placing Prosperity: Neighborhoods and Life Expectancy in the New Orleans Metro. Retrieved from https://www.datacenterresearch.org/placing-prosperity/
    3. Knight, J. A. (2012). Physical inactivity: associated diseases and disorders. Annals of Clinical & Laboratory Science, 42(3), 320-337.
    4. Rosenberger, R. S., Sneh, Y., Phipps, T. T., & Gurvitch, R. (2005). A spatial analysis of linkages between health care expenditures, physical inactivity, obesity and recreation supply. Journal of Leisure Research, 37(2), 216-235.
    5. Scholes, S., Bann, D. (2018) Education-related disparities in reported physical activity during leisure-time, active transportation, and work among US adults: repeated cross-sectional analysis from the National Health and Nutrition Examination Surveys, 2007 to 2016. BMC Public Health,18, 926. https://doi.org/10.1186/s12889-018-5857-z
    6. Harper, S., & Lynch, J. (2007). Trends in Socioeconomic Inequalities in Adult Health Behaviors among U.S. States, 1990–2004. Public Health Reports, 122(2), 177–189.
    7. Idler, Ellen L., and Angel, Ronald J. (1990) “Self-Rated Health and Mortality in the NHANES-I Epidemiologic Follow-Up Study.” American Journal of Public Health, 80(4), 446-452.
    8. Jylhä, M. (2009). What is self-rated health and why does it predict mortality? Towards a unified conceptual model. Social science & medicine, 69(3), 307-316.
    9. Idler, E. L., & Benyamini, Y. (1997). Self-rated health and mortality: a review of twenty-seven community studies. Journal of health and social behavior, 21-37.
    10. Jia, H., Muennig, P., Lubetkin, E. I., & Gold, M. R. (2004). Predicting geographical variations in behavioural risk factors: an analysis of physical and mental healthy days. Journal of Epidemiology & Community Health, 58(2), 150-155.
    11. Biener, A., Cawley, J., & Meyerhoefer, C. (2017). The high and rising costs of obesity to the US health care system. Journal of general internal medicine, 32(1), 6-8. https://doi.org/10.1007/s11606-016-3968-8.
    12. Habans, R., Losh, J, Weinstein, R., and Teller, A. (2020). Placing Prosperity: Neighborhoods and Life Expectancy in the New Orleans Metro. Retrieved from https://www.datacenterresearch.org/placing-prosperity/.
    13. Franzini, L., Ribble, J. C., & Keddie, A. M. (2001). Understanding the Hispanic paradox. Ethnicity & disease, 11(3), 496–518. https://pubmed.ncbi.nlm.nih.gov/11572416/.
    14. Palloni, A., & Arias, E. (2004). Paradox lost: explaining the Hispanic adult mortality advantage. Demography, 41(3), 385-415.
    15. Goldman N. (2016). Will the Latino Mortality Advantage Endure?. Research on aging, 38(3), 263–282. https://doi.org/10.1177/0164027515620242.
    16. Chetty, R., Stepner, M., Abraham, S., Lin, S., Scuderi, B., Turner, N., & Cutler, D. (2016). The association between income and life expectancy in the United States, 2001-2014. JAMA, 315(16), 1750-1766. doi:10.1001/jama.2016.4226.
    17. Galea, S., Tracy, M., Hoggatt, K. J., DiMaggio, C., & Karpati, A. (2011). Estimated deaths attributable to social factors in the United States. American journal of public health, 101(8), 1456-1465. https://doi.org/10.2105/AJPH.2010.300086.
    18. Di, Q., Dai, L., Wang, Y., Zanobetti, A., Choirat, C., Schwartz, J. D., & Dominici, F. (2017). Association of Short-term Exposure to Air Pollution With Mortality in Older Adults. JAMA, 318(24), 2446–2456. https://doi.org/10.1001/jama.2017.17923.
  • Mental Health

    Mental Health

    Mental Health

    Mental health conditions are common in the region, yet residents struggle to access mental health services in Houston

    Our region continues to see an increase in mental distress frequency, drug use, and suicides, exacerbating the existing mental health challenges across Houston. While the number of mental health care workers per resident has improved, our region’s access to professional mental health help remains significantly lower than the national rate.

    Why mental health matters to Houston

    Like physical health, mental health is critical to well-being. Mental health enables us to function in our everyday lives, reflecting our psychological, emotional and social well-being. It affects our thoughts and behaviors, helps us maintain fulfilling relationships, enables us to cope with change and adversity, and ultimately supports our contributions to society. Research shows that mental health is also closely connected with physical health. Depression and anxiety, for example, may affect the ability to maintain health-promoting behaviors. Additionally, physical health conditions such as chronic diseases can have a significant impact on mental health.1

    Everyone has mental health concerns from time to time. A mental health concern becomes a mental illness when symptoms cause frequent stress that affects one’s ability to function in daily life. Mental illness, a term used to refer to diagnosable mental disorders, can alter thoughts, moods, and behaviors, and may cause distress, impairment, pain or even death.2 Building greater awareness of the importance of mental health and reducing stigma associated with mental illness can ultimately improve the quality of life and well-being for all Houstonians.

    As we gain a deeper understanding of our residents’ mental health needs, we can effectively direct crucial mental health resources, contributing to a vibrant, healthy Houston.

    The data

    Nearly one in five teenagers in Texas experience a major depressive episode

    Mental illnesses are common in the United States. About 23% of U.S. adults (61.5 million) lived with a mental illness in 2024. The prevalence of mental illness was higher among women (27%) than men (20%). Young adults aged 18–25 had a higher prevalence of mental illness (33%) than adults 50 and older (15%). White adults are more likely to report mental health issues than people of color.3 However, the consequences of mental illness in people of color may be more persistent, meaning even though they might have lower reported rates, they are less likely to seek mental health treatment (or receive effective treatment), and their mental health conditions might not improve over time.4 Lack of cultural understanding by providers and social stigma may contribute to the underdiagnosis of mental illness among people of color and the immigrant population. Mental health problems are also common among people in the criminal legal system. Estimates suggest between 60% to 70% of youth in the juvenile legal system meet the criteria for a mental health disorder.5

    Mental illness varies in levels of severity. Serious mental illness is defined as a mental, behavioral or emotional disorder resulting in serious functional impairment that substantially interferes with or limits one or more major life activities. Nationwide, nearly 6% of adults (14.6 million) experienced serious mental illness in 2024.

    Not only young adults, but youth aged 12–17 also report higher levels of serious mental illness compared to older adults. In 2022 and 2023, 19% of kids aged 12-17 reported having a major depressive episode — one of the most prevalent serious mental illnesses affecting both youth and adults. This is similar to the rate seen in young adults aged 18-25, but more than twice the rate seen in adults aged 26 and up. In Texas, the rates for youth experiencing a major depressive episode are 17%, slightly lower than the U.S. average.

    Young people aged 12-17 and 18-25 are more than twice as likely as adults aged 26 and up to report experiencing a major depressive episode

    Overall, a national analysis of states across seven measures ranked Texas 5th for the prevalence of mental health, indicating a lower number of mental illness and substance abuse cases among the Texas population compared to other states and districts.

    Residents in the Houston region report an increase in mental distress frequency

    The average number of mentally unhealthy days — days involving significant amounts of stress, depression or other emotional distress — is a self-reported quality-of-life measure. Research has shown that it is a reliable estimate of an individual’s recent mental health condition and a predictor of future adverse health events. Counties with more unhealthy days were likely to have higher unemploymentpoverty, and undesirable educational and health outcomes than counties with fewer unhealthy days.6

    Between 2016 and 2022, the average number of mentally unhealthy days increased in Texas and the U.S. overall. Prior to 2022, the average number of poor mental health days within a month reported by Texas residents was lower than the national average. However, in 2022, Texas matched the U.S. with an average of 5.1 poor mental health days.

    Prior to 2019, Harris and Montgomery counties reported slightly fewer mentally unhealthy days than the national average. As of 2022, adults in Harris County reported an average of 5.7 days with poor mental health and 5.7 days in Harris County. Fort Bend County residents have consistently experienced the lowest number of mentally unhealthy days at 4.6 in 2022.

    The average number of mentally unhealthy days Montgomery County residents experience in a month increased by 2.5 days between 2016 and 2022

    Adults who experience frequent mental distress are those who report 14 or more days of poor mental health in the past month. Research has found a strong relationship between frequent mental distresses and clinically diagnosed mental disorders, such as depression and anxiety.7 Frequent mental distress is associated with unhealthy behaviors such as smoking and physical inactivity, risk factors such as housing and food insecurity, and is more common among women.8,9

    The proportion of adults experiencing frequent mental distress in Texas increased to 16% in 2022 from 12% in 2017. Harris and Montgomery counties have a higher percentage of adults who reported 14 or more days of poor mental health in a one-month period in 2022 (19%) compared to Fort Bend County (15%).

    Many factors contribute to mental health, including our biology, personal experience and family history. However, certain populations report a higher frequency of mentally unhealthy days.

    In the nine-county Houston Metropolitan Statistical Area (MSA), Texas, and across the U.S., women report experiencing more days of poor mental health than men, although the gap in the Houston MSA is smaller. Between 2019 and 2023, the rate of adults reporting poor mental health for 14 or more days within one month increased both nationally and in Texas across all demographic groups.

    During the same time in the Houston MSA, this rate was flat for the overall population, decreased for female, Black, and Hispanic residents, and increased for male and white residents. In 2019 in Houston, Hispanic residents experienced the highest rates of frequent mental distress, and as of 2023, white residents in the Houston area experienced the highest rates of frequent mental distress.

    The percentage of Hispanic residents in Houston reporting 14 or more days of poor mental health decreased by nearly 4 points between 2019 and 2023.

    Illicit drug use among young adults has increased

    Alcohol consumption has been linked to poor mental health. People may use alcohol to relieve symptoms of stress, anxiety, and depression, but long-term alcohol use and binge drinking often leads to a worsening of mental health.10 The CDC defines binge drinking as adults who have at least five drinks (men) or at least 4 drinks (women) on one or more occasions during the previous 30 days.

    Between 2019 and 2022, the percentage of adults who report binge drinking remained flat in Fort Bend, decreased in Harris County, and increased in Montgomery County. As of 2022, about 16% of adults in Fort Bend and Harris counties report binge drinking, whereas 19% of adults in Montgomery County do.

    In the U.S., more than one in three adults living with any mental illness also has a substance use disorder, defined by the CDC as a treatable, chronic disease characterized by a cluster of symptoms indicating that the individual continues using the substance despite significant substance-related problems. Of adults with a serious mental illness, nearly half also has a substance use disorder. These issues affect people across the country regardless of background or age.

    In Texas, the rate of illicit drug use is lower for all ages compared to the nation. In 2022–23, 19% of young adults aged 18 to 25 in Texas report using an illicit drug whereas 27% of that group across the country have used an illicit drug. However, the trends in illicit drug use across age groups are the same in Texas and the country overall:  among children 12 to 17, rates of illicit drug use increased from 2016–17 to 2018–19 and then decreased in 2022–23. For young adults aged 18 to 25 and adults 26 years and older, illicit drug use consistently increased between 2016–17 and 2022–23.

    The rate of illicit drug use for Texans aged 26 and older nearly doubled between 2016–17 and 2022–23

    Rates and levels of suicide in the Houston region are on the rise

    Mental health disorders can lead to suicide, though the majority of people who struggle with their mental health do not go this route — estimates indicate about 5–8% of people with a mental health condition attempt suicide,11,12 though about 46% of people who die by suicide had a diagnosed mental health condition. In addition to mental health conditions, environmental risk factors such as prolonged or extreme stress and access to firearms or drugs can increase risk of suicide. Historical factors such as suicide attempts, childhood abuse, and family history of suicide can also increase the risk.13

    In 2023, suicide was the 11th leading cause of death in the U.S. However, it was the second leading cause of death for American children ages 10–14, 15–24, and young adults 25–34.

    Suicide was the second leading cause of death among American children between 10 and 14 years of age in 2023.

    Suicide accounted for the loss of 3,064 lives in the three-county area between 2020 and 2023, an increase of 80% compared to the time period between 2000 and 2003. Between 2000–03 and 2020–23, the number of suicides increased 156% in Fort Bend County, 64% in Harris County, and 140% in Montgomery County. (Fort Bend and Montgomery counties have also experienced substantial population growth during that time period.)

    In order to account for population differences, the suicide rate (calculated as the number of suicides per 100,000 people) is a better indicator of suicide prevalence.

    The suicide rate in the three-county Houston region has also increased over the last two decades to 12.1 per 100,000 residents in 2020–23 from 10.1 in 2000–03. The 2020–23 suicide rate in the Houston area remains lower than in Texas, where there were 14.1 suicides per 100,000 residents, and the rate in Texas is slightly lower than in the nation overall (14.5 per 100,000). Between 2000 and 2023, the suicide rate increased 36% in Texas.

    Montgomery County’s suicide rate is the highest in Houston’s three-county region and above the rate of Texas and the nation overall. In 2020–23, Montgomery County’s suicide rate was 17.1 per 100,000 compared to 11.9 in Harris County and 9.4 in Fort Bend County.

    While self-reported mental illness is more prevalent among women, men are more likely to attempt suicide. Nationally, men died by suicide at a rate 3.8 times that of women in 2020–23. In particular, white males account for most suicides across all age groups.

    Men are more likely to attempt suicide, and they die by suicide at a rate 3.8 times that of women.

    The suicide rate per 100,000 men in Texas during the 2020–23 period is 36% higher than that in 2000–03. In all three counties and the state, the suicide rate for males increased more between 2000–03 and 2020–23 than for females, with the suicide rate for males increasing at a rate twice that of females in Fort Bend and Harris counties.

    Availability of mental health services in Houston has improved, but remains lower than national rates

    Nearly one in five adults has some form of mental health condition, contributing to increased financial costs, disability and death rates in recent years.14 However, the availability of mental health resources remains stagnant, as the supply of mental health providers cannot keep up with growing needs. In fact, about 122 million people across the country live in Mental Health Care Professional Shortage Areas (HPSAs). And in Texas, more than 13 million people live in HPSAs, with only 31% of the need being met. KFF estimates that an additional 614 health care practitioners could alleviate the mental health care professional shortage in the state.  These challenges are layered on top of low coverage rates for health insurance in Houston and across the state.

    Mental health care providers include psychiatrists, psychologists, licensed clinical social workers, counselors, family therapists, providers that treat substance abuse and chemical dependency, and advanced nurse practitioners specialized in mental health care. These professionals provide essential care to both adults and children who have a mental disorder. To measure access across geographic units with different population sizes, we use the ratio of the population to mental health providers. The higher the ratio, the lower the access to mental health providers.

    Typically, mental health professionals are concentrated in urban areas. About 10,600 registered mental health providers were practicing in Houston’s three-county area in 2024, more than double the number in 2016, and availability has improved across all geographies over this time period. Despite this growth, mental health care availability in Texas is half that in the U.S. overall. As of 2024, there are 590 residents for every one mental health provider in Texas compared to 300 to 1 nationally. In fact, according Mental Health America’s 2024 State of Mental Health Report, Texas ranks last among all 50 states and the District of Columbia in access to mental health care.

    Harris County’s ratio of residents to mental healthcare providers is about on par with the state of Texas, while Fort Bend County has historically had the lowest access to mental health treatment. As of 2024, the availability in Fort Bend County (840:1) remained lower than in Montgomery County (780:1) both of which were lower Harris County (560:1). Low-income areas and rural communities have less access to mental health care in Houston because of fewer mental health treatment facilities and providers in general.15

    Houston-area residents have significantly less access to mental health care providers than the national average.

    Helpful Articles by Understanding Houston:

    Resources

    References:

    1. Lando, James, Sheree Marshall Williams, Stephanie Sturgis, and Branalyn Williams. (2006). A logic model for the integration of mental health into chronic disease prevention and health promotion.Preventing chronic disease, 3(2)). Healthy People 2020.
    2. U.S. Department of Health & Human Services. (2020). Mental Health and Mental Disorders. Healthy People 2030.
    3. SAMHSA, Center for Behavioral Health Statistics and Quality, National Survey on Drug Use and Health, 2019 and Quarters 1 and 4, 2020 https://www.samhsa.gov/data/report/2024-nsduh-detailed-tables
    4. Budhwani, Henna, Kristine Ria Hearld, and Daniel Chavez-Yenter. (2015). Depression in Racial and Ethnic Minorities: The Impact of Nativity and Discrimination. Journal of racial and ethnic health disparities, 2(1) 34-42. https://link.springer.com/content/pdf/10.1007%2Fs40615-014-0045-z.pdf
    5. Shufelt, J. L., & Cocozza, J. J. (2006). Youth with mental health disorders in the juvenile justice system: Results from a multi-state prevalence study (pp. 1-6). Delmar, NY: National Center for Mental Health and Juvenile Justice.
    6. Jia, H., Muennig, P., Lubetkin, E. I., & Gold, M. R. (2004). Predicting geographical variations in behavioural risk factors: an analysis of physical and mental healthy days. Journal of epidemiology and community health, 58(2), 150–155. https://doi.org/10.1136/jech.58.2.150
    7. Shih, M., Simon, P.A. (2008). Health-related quality of life among adults with serious psychological distress and chronic medical conditions. Qual Life Res 17, 521–528. https://doi.org/10.1007/s11136-008-9330-9
    8. John Bruning, Ahmed A. Arif, James E. Rohrer (2014). Medical cost and frequent mental distress among the non-elderly US adult population. Journal of Public Health, 36(1), 134–139, https://doi.org/10.1093/pubmed/fdt029
    9. Liu, Y., Croft, J.B., Wheaton, A.G. et al. (2013). Association between perceived insufficient sleep, frequent mental distress, obesity and chronic diseases among US adults, 2009 behavioral risk factor surveillance system. BMC Public Health 13, 84. https://doi.org/10.1186/1471-2458-13-84
    10. Jané-Llopis, E. V. A., & Matytsina, I. (2006). Mental health and alcohol, drugs and tobacco: a review of the comorbidity between mental disorders and the use of alcohol, tobacco and illicit drugs. Drug and alcohol review, 25(6), 515-536.
    11. Inskip, H., Harris, C., & Barraclough, B. (1998). Lifetime risk of suicide for affective disorder, alcoholism and schizophrenia. The British Journal of Psychiatry, 172(1), 35-37.
    12. Nordentoft, M., Mortensen, P. B., & Pedersen, C. B. (2011). Absolute risk of suicide after first hospital contact in mental disorder. Archives of general psychiatry, 68(10), 1058-1064.
    13. Miller, M., Azrael, D., & Barber, C. (2012). Suicide Mortality in the United States: The Importance of Attending to Method in Understanding Population-Level Disparities in the Burden of Suicide. Annual Review of Public Health, 33(1), 393–408. https://doi.org/10.1146/annurev-publhealth-031811-124636
    14. Whitney, D. G., & Peterson, M. D. (2019). Disparities in Prevalence and Treatment of Mental Health Disorders in Children—Reply. JAMA Pediatrics, 173(8), 800–801. https://doi.org/10.1001/jamapediatrics.2019.1620
    15. Cummings, J. R., Wen, H., Ko, M., & Druss, B. G. (2013). Geography and the Medicaid Mental Health Care Infrastructure: Implications for Health Care Reform. JAMA Psychiatry, 70(10), 1084–1090. https://doi.org/10.1001/jamapsychiatry.2013.377