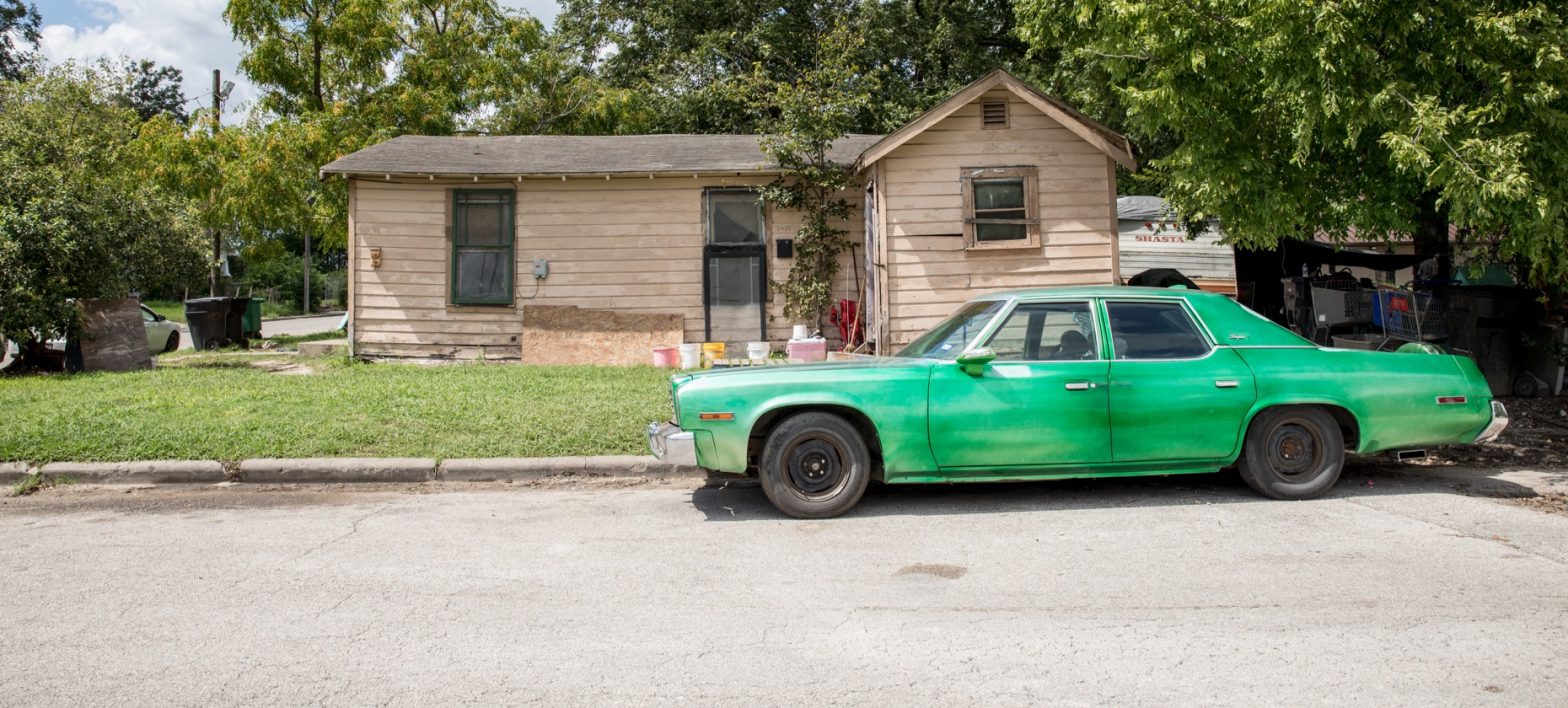
Poverty and Economic Mobility in Houston
Too many Houston-area families are stuck in the cycle of intergenerational poverty, preventing economic mobility
Despite a slight decline in poverty rates over the last decade, over one million households in Houston’s three-county region struggle to afford basic necessities.
Why poverty and economic mobility matter to Houston
Poverty has devastating consequences for individuals and families, entire communities, and our collective future. People who live in communities with high concentrations of poverty are at higher risk for cognitive1 2 and mental/ behavioral health challenges,3 chronic disease,4 higher mortality,5 and lower life expectancy.6 7 Children that grow up in poverty have higher prevalence of developmental delays,8 9 toxic stress,10 and chronic illness;11 they are also more likely to leave high school without a diploma,12 have fewer job prospects,13 or interact with the criminal system.14 Individuals who experience poverty as a child are more likely to experience poverty into adulthood, which contributes to intergenerational cycles of poverty.15 Intergenerational poverty not only prevents many from achieving their full potential, but also it holds back our collective society because we can’t benefit from the full talents and participation of our region’s most valuable asset — our people.
By working together to lift our neighbors out of poverty and into economic security, we can build a more vibrant Houston region with opportunity for all.
The data
Despite declining poverty rates since 2010, 54,000 more Houstonians live in poverty
The Official Poverty Measure was developed in the mid-1960s by Mollie Orshansky, an economist at the Social Security Administration, to measure the Lyndon B. Johnson Administration’s success in its “War on Poverty.” Her formula was derived from the cost of a minimum food diet for different family sizes, which she believed accounted for a third of a family’s overall budget. Orshansky concluded, if a family earned less than three times the cost of food, then they lived below the poverty threshold. Today’s measure is still based on this original calculation and is updated annually for inflation.
This measure, while consistent over decades, has limitations: It does not account for geographic cost-of-living differences — the threshold is the same regardless of where one lives in the continental United States; supplemental income such as tax credits, housing vouchers, or Medicare is not considered part of income; and the definition of a “family” is narrowly defined.16 According to the U.S. Census Bureau, “The official poverty measure is based on pretax cash income, while the Supplemental Poverty Measure (SPM) includes noncash benefits such as the Supplemental Nutrition Assistance Program (SNAP) and housing subsidies as well as net income after payroll taxes, tax credits and other necessary expenses.”
In 2023, the Federal Poverty Line, or poverty threshold, was $15,060 for an individual and $31,200 for a family of four. Based on this definition, 40.8 million Americans lived below the poverty level. Comprising 13% of the population, 1 out of 8 Americans live in poverty, according to the official measure.
In 2023, the poverty rate was 9% in Fort Bend, 16% in Harris, and 11% in Montgomery County. In Houston’s three-county region, the poverty rate is consistently lowest in Fort Bend County and highest in Harris County. Nearly 924,000 Houston-area residents lived below the poverty line in 2023.
Over the last decade, poverty rates in each Houston-area county steadily declined from 2010 to a decade-low in 2019, before ticking back up in 2021. Between 2010 and 2019, the share of people living below the poverty line fell by 2.8 percentage points in Fort Bend, 3.6 points in Harris, and 2.6 points in Montgomery counties. Between 2021 and 2023, poverty rates remained flat in Harris County, fluctuated in Montgomery County but ultimately ticked down by nearly one point, and increased 2.1 percentage points in Fort Bend County.
While the percentage of Houston-area residents who live in poverty is lower in 2023 than in 2010, the number of people living in poverty has increased during this period. As of 2023, the number of people living in poverty was 81,000 in Fort Bend County, 767,000 in Harris County, and 76,000 in Montgomery County.
Racial characteristics of poverty in Houston’s three county region
In the United States, poverty and race are strongly connected,17 with poverty rates generally highest among the Black population and lowest among the white population (among the four largest racial/ethnic groups). That this disparity exists in nearly every state and county in the nation, suggests that this lack of equality can be attributed more to the institutional disadvantages and discrimination that has been embedded into the various systems that guide American life — education, healthcare, housing, employment — than to individual characteristics.18
Exacerbating racial/ethnic disparities, Black families are 16 times more likely to have lived in poverty for at least three generations compared to white families, according to an analysis from Brookings Institution. One in five Black Americans (21.3%) are experiencing poverty for the third consecutive generation, compared to one in a hundred white Americans (1.2%).
A 2024 Opportunity Insights paper reveals that while significant racial disparities do still exist, the national Black-white mobility gap has shrunk by nearly 30% in the past 15 years. Comparing two birth cohorts, people born in 1978 and 1992, this study found that Black children born to low-income (25th percentile) parents in 1992 earned more as adults than those born in 1978. Meanwhile, white children from similar backgrounds saw a decline in earnings across cohorts. However, disparities remain. On average, the earnings gap between Black and white adults who grew up in low-income families is $13,000. We see a similar trend in median household income by race and ethnicity regionally and for the state and nation where racial disparities in income do still exist but these gaps have narrowed between 2010 and 2023.
Read more about race and economic mobility.
In 2023, 9.4% of white Americans nationwide lived in poverty, while the figures were 20.8% for the Black population, 16.7% for the Hispanic population, and 9.9% for Asian Americans. Poverty rates in Harris County and Texas closely mirror these national statistics.
In Fort Bend and Montgomery counties, the poverty rate is highest among the Hispanic population at 12.4% and 17.0% respectively. In Harris County, Black residents experience the highest poverty rate (21.2%), which is more than triple the rate for white residents (6.9%), followed closely by Hispanics (20.6%).
In Montgomery County, the proportion of the Hispanic population living below the poverty threshold fell by 8.7 percentage points between 2010 and 2023 — the greatest decline among racial/ethnic groups in the county—followed by a 5.3-percentage-point decline for the Black population in Montgomery County. In Harris County, Hispanic residents experienced the greatest declines in poverty rates (5.8 percentage points), followed by Asian Americans (5.5-percentage-point decline). In Fort Bend County, the poverty rate fell by 3.5 percentage points among Black residents and 3.1 for Hispanic residents compared to a 3.9-percentage-point increase for Asian American residents in Fort Bend County. Across all three counties between 2010 and 2023, the poverty rate for white residents was stagnant.
Single-parent families and poverty in Houston’s three-county region
Across the United States, the percent of families led by single parents declined from around 15% in 2010 to 13% in 2023. Locally, the share of families led by single parents in 2023 was 9% in Fort Bend County, 16% in Harris County, and 11% in Montgomery County. However, despite the declining rates, the number of single-parent led families in Houston’s three-county area has increased in the last decade because of the area’s growing population. The increase in this family structure is a concern because families led by single parents are five times more likely to live below the poverty threshold than two-parent-households. Among single-parent families in the United States, 70% are headed by women; and nearly 1 in 3 (32.2%) households led by single-moms lives in poverty compared to 1 in 18 (5.7%) households led by married couples.
In Harris County, 37% of single-mom families with children under 18 live in poverty — nearly 4 times the rate of married-couple families but a 5-percentage-point decreased compared to over a decade ago. In Montgomery County, the rate of single-mom families with children living in poverty is roughly five times that of married-couple families and has experienced a smaller decrease of 2 percentage points. We see the same gap in Fort Bend County between single-mom and married-couple families but the rate of single-mom families with children living in poverty has not improved over time although it is the lowest in the Houston three-county region.
Nearly one out of four children in Harris County lives in poverty
Research has shown that children growing up in poverty are more likely to face chronic stress and conditions that leave permanent changes in their brains, with implications for learning, health and behavior.19 Children who have lived many years in poverty are 90% more likely than their peers who never lived in poverty to enter their 20s without completing high school and, for girls, are four times more likely to become a teen mother setting the stage for the intergenerational transmission of disadvantage and onset of chronic poverty.20
Poverty rates for children are typically higher than for adults. The proportion of children under 18 living in poverty in 2023 was 10.4% in Fort Bend, 23% in Harris, and 15% in Montgomery County. Fort Bend and Montgomery counties have lower rates of children living in poverty compared to the state (18.4%) and the nation (16%) while Harris County has a higher rate.
Between 2010 and 2023, poverty rates for children under 18 have declined more than 5 percentage points across the nation, with the greatest declines occurring between 2010 and 2019. Between 2019 and 2021, poverty rates ticked back up in each county, the state, and nation — and in the case of Montgomery County, reversed all gains from the previous decade. As of 2023, the poverty rate in all three counties remains higher than it was in 2019.
Poverty rates for children 5 and under are even higher than they are for all children although this difference has decreased over the years. The proportion of children 5 and under living in poverty in 2023 was 10.5% in Fort Bend, 23.7% in Harris, and 15.1% in Montgomery County. Poverty trends for children 5 and under steadily declined between 2010 and 2019, but then ticked up during the pandemic, according to 2021 data. Between 2010 and 2023, poverty rates for children 5 and under decreased more across the state (-9.4 percentage points) and the nation (-8 points) compared to a decrease of 4.5 points in Fort Bend, 6.6 points in Harris, and 7.7 points in Montgomery counties.
In 2023, 10.0% of white children under 18 were experiencing poverty across the nation, compared to 29.3% of Black children, 21.6% of Hispanic children and 10.0% of Asian American children. The poverty rate for non-white children under 18, and children overall, in Harris County exceeds both national and state levels, while the rate of white children experiencing poverty in Harris County is lower.
Number of youths aged 16 to 19 neither working nor pursuing education decreases in Montgomery County and across the U.S.
Young people between the ages of 16 and 24 who are not enrolled in school or not working are classified as “opportunity youth.” Once a young person becomes disengaged from school or work, it becomes increasingly difficult to reconnect them to opportunities in education and skill development.21 Being disconnected is both a consequence and a cause of poverty, and opportunity youth are twice as likely to live in poverty as their connected peers and are less likely to be employed, own a home, or report good health when they reach their thirties.22
Approximately 8% of the 16-to-19-year-old population are neither working nor attending school in Texas, a higher share compared to the national average (6.9%). Fort Bend and Montgomery counties have the lowest rate of 16-to-19-year-olds considered opportunity youth at 5.8% and 5.1% respectively compared to 8.7% in Harris County. Between 2010 and 2022, the proportion of youth neither in school nor working decreased the most in Montgomery County by 3.1 percentage points. However, the number of opportunity youth increased in Fort Bend and Harris counties by 32% and 2% respectively while the number decreased by 9% in Montgomery County. This is compared to a 4% increased in the number of opportunity youth across the state and a 17% decrease across the nation.
One out of three Houston-area households experience ALICE
Because the Official Poverty Measure has such a low financial threshold, it is not a strong indicator to assess a population’s overall level of economic security. Although many believe that having a full-time job with a steady income allows someone to overcome poverty, the reality is that many full-time workers struggle to make ends meet. Indicators that take into consideration more realistic costs of living show that many working families are struggling.
The acronym ALICE stands for Asset Limited, Income Constrained, and Employed. It represents families that are working but unable to afford all their basic necessities like housing, food, childcare, health care and transportation. ALICE income thresholds include a more realistic cost of living than federal poverty guidelines.
To put things in perspective, the Texas cost-of-living in 2022 was $72,816 for a family of four and $26,268 for a single adult, which are both significantly higher than the Federal Poverty Level of $29,950 for a family of four and $14,880 for a single adult in 2022. ALICE income thresholds across all three counties indicate that a more realistic “survival budget” for a family of four is at least $78,012. With Harris County’s median household income below this threshold, it is no surprise we see higher portions of ALICE households in Harris County than in either Montgomery or Fort Bend counties.
Nearly one in three Houston-area households were classified as ALICE (Asset Limited, Income Constrained, Employed) in 2022, which is slightly higher than the state (29%) and national rate (29%). The proportion of households classified as ALICE was 27% in Fort Bend, 32% in Harris, and 27% in Montgomery counties. This is on top of the percentage of households that live below the Federal Poverty Line.
Over one million households (44%) in Houston’s three-county region either live below the poverty threshold or experience ALICE. While the number of households in poverty increased between 2010 and 2022 in the three-county region by 24%, the number of ALICE households increased at a much faster rate during the same period by 49% primarily as a result of rising costs and stagnant wages.
Economic mobility in the Houston area
Economic mobility, or intergenerational mobility, measures the percentage of children who grow up to earn more than their parents. To a great extent, it is a central component of the “American Dream.” It reflects the aspiration that through hard work and determination anyone can achieve their highest goals and fullest potential.
Per Opportunity Insights, a Harvard-based research nonprofit that conducts scientific research on how to improve upward mobility, more than 90% of children born nationally in the 1940s grew up to earn more than their parents. But over the past 50 years, this rate has been in decline, and is now only 50%, contributing to growing income inequality across the country. Research from Opportunity Insights shows upward economic mobility largely depends upon where one lives during childhood and the type of resources their family possesses. Children raised in low-income families have a much harder time securing higher incomes in adulthood.
The discrepancies illustrated by the Opportunity Atlas tool help to shed light on how different neighborhoods shape the development of human capital and support economic growth.23 A rigorous study found that the longer a child lived in a lower-poverty environment (defined as having a poverty rate below 10%) during childhood, the higher their chance to have better long-term outcomes.24 By moving families to a high mobility neighborhood that has a low poverty rate, more stable family structures, greater social capital, and better school quality, children from those families can make income gains in adulthood. The research suggests the need for a holistic approach to reduce racial disparities and improve upward mobility for all.
Economic mobility outcomes by income
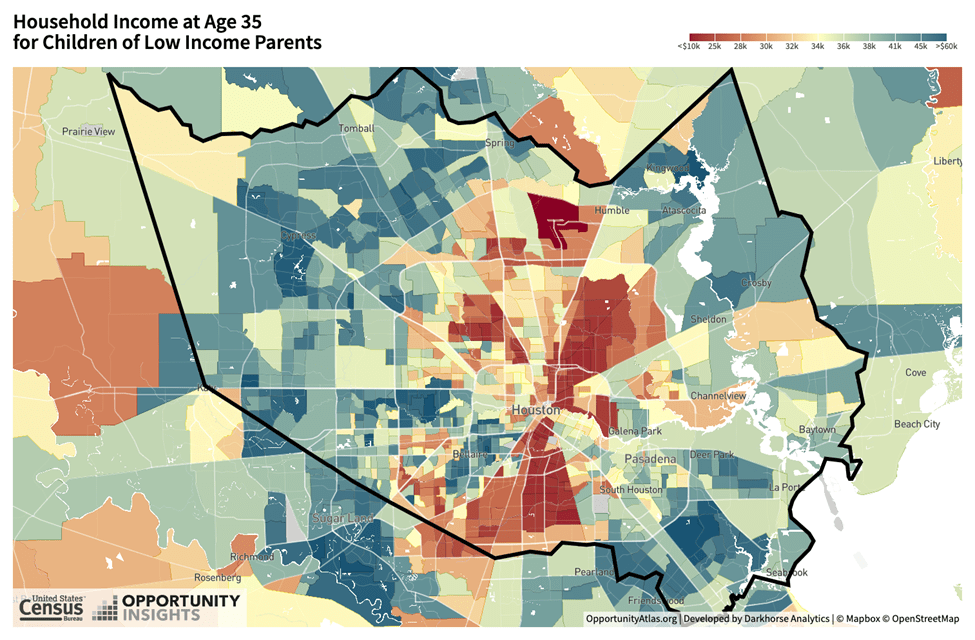
The maps below show economic mobility as the future incomes for children from low-income families, with red indicating lower future earnings while blue shows higher earnings. Across the country this map shows that economic mobility for children of low-income parents is lowest in the southeastern region of the U.S. and highest in the northern region.
In Harris County, for example, the average child born between 1978 and 1983 from a low-income family (defined as families at the 25th percentile of household income) earns a household income of $33,000 at age 35. A low-income child of the same birth cohort in Fort Bend County earns $35,000 a year, and in Montgomery County earns $36,000 a year. In all three cases, the average child barely improves upon the income of the household in which they grew up.
Within each county, one’s childhood ZIP code can tell a great deal about expected outcomes. On average, a child from a low-income family raised in Bellaire, a high-income community in Southwest Harris County, surrounded by a peer group from a higher-income bracket has a much greater chance of earning a higher household income (over $40,000) than a low-income child raised in Fifth Ward ($23,000), a low-income community just north of downtown Houston. Similarly, a child from a low-income family who grew up in New Caney, between I-45 and I-59 in Northeast Harris County, earns a household income of $33,000 as an adult, compared to a low-income child from The Woodlands, a wealthy township in south Montgomery County, making around $50,000.
A child from a low-income family, defined as families in the 25th percentile of household income, raised in Greater Third Ward, a high-poverty area just south of downtown Houston, and a child raised in North Forest, a low-income community in Northeast Houston between 610 and beltway 8 loops, have equal chances of earning a household income of $20,000 in adulthood
Household income at age 35 for children of low-income parents by neighborhood/census tract where they grew up in Harris County.
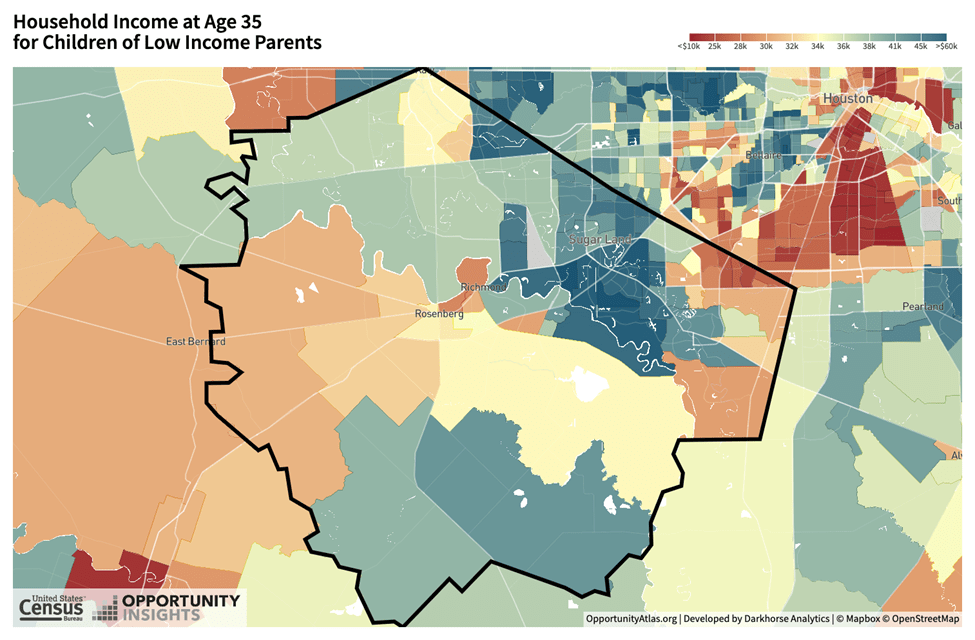
Household income at age 35 for children of low-income parents by neighborhood/census tract where they grew up in Fort Bend County.
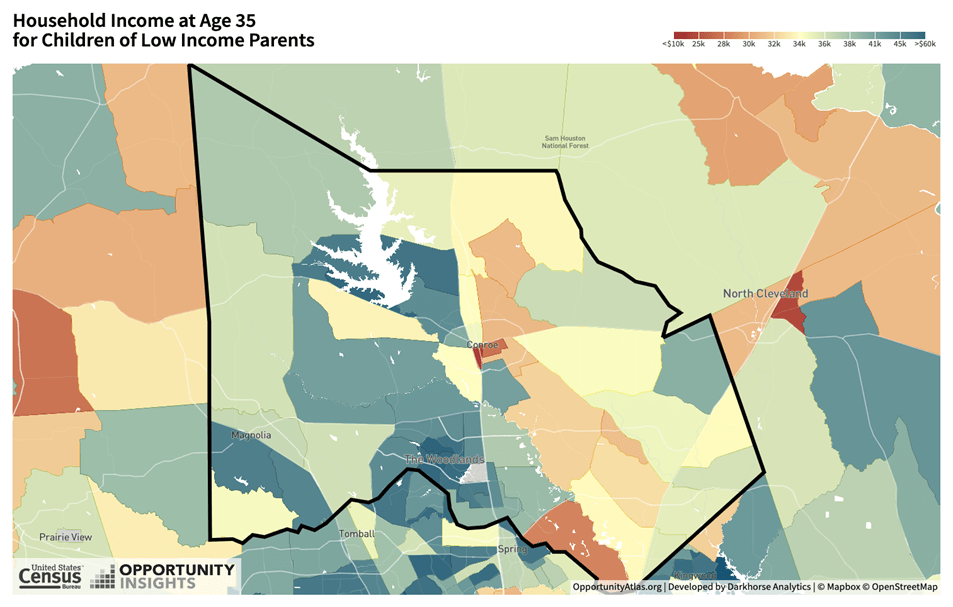
Household income at age 35 for children of low-income parents by neighborhood/census tract where they grew up in Montgomery County.
Economic mobility trends by income
This Mobility Outcomes map created by Opportunity Insights allows us to explore how economic mobility across the nation differs by place, race, gender, and class. In the summer of 2024, Opportunity Insights built upon this initial research and created the Mobility Trends map, which allows us to see how economic mobility is, or isn’t, improving over time and for whom.
On the left, the Mobility Outcomes map shows economic mobility as the future incomes for children from low-income families, with red indicating lower future earnings while blue shows higher earnings. Across the country this map shows that economic mobility for children of low-income parents is lowest in the southeastern region of the U.S. and highest in the northern region.
On the right, the Mobility Trends map, building on the Mobility Outcomes map, shows changes in economic mobility on the county-level by comparing income differences, over time, of adults born into similar places and circumstances. Like the Mobility Outcomes map, areas that show the greatest improvements in economic mobility are shaded in blue while places with deteriorating economic mobility are shaded in red.
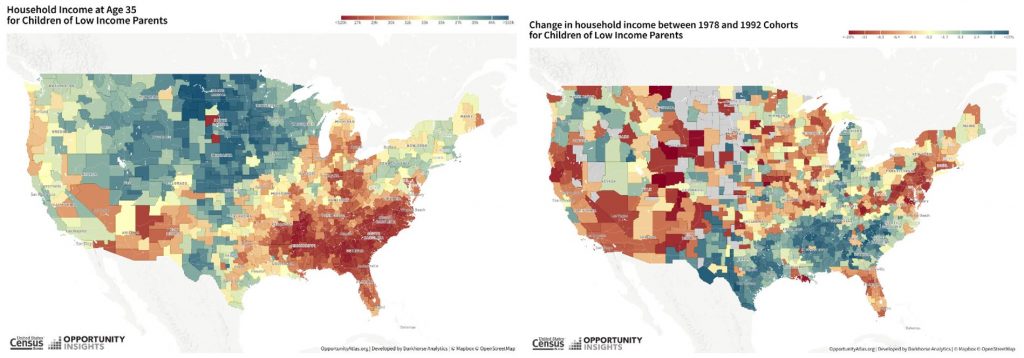
Are the future incomes of children born into low-income families in 1992 higher than the future incomes of similar children born in 1978? It depends. Nationally, the future income of children from low-income (25th percentile) families born in 1992 is 4.2% lower than similar children born in 1978. This is compared to it being stagnant for children born to high-income (75th percentile) parents suggesting increasing class gaps at the national level.
In our three-county region, the change in economic mobility (the difference in adult earnings between those born in 1992 and those born in 1978) stagnated for children born to low-income and children born to high-income parents.
However, comparing changes in economic mobility for children born to the lowest-income (1st percentile) and highest-income (100th percentile) parents tells a much different story.
Economic mobility for children born to the lowest-income parents has increased by 2% in Montgomery County while it has not changed in Fort Bend and Harris counties. For children born to the highest-income parents, there was an increase of 6.1% in Fort Bend County, 6.7% in Harris County, and 4% in Montgomery County, pointing to an increasing income gap across our region between children born to the lowest- and highest-income households.
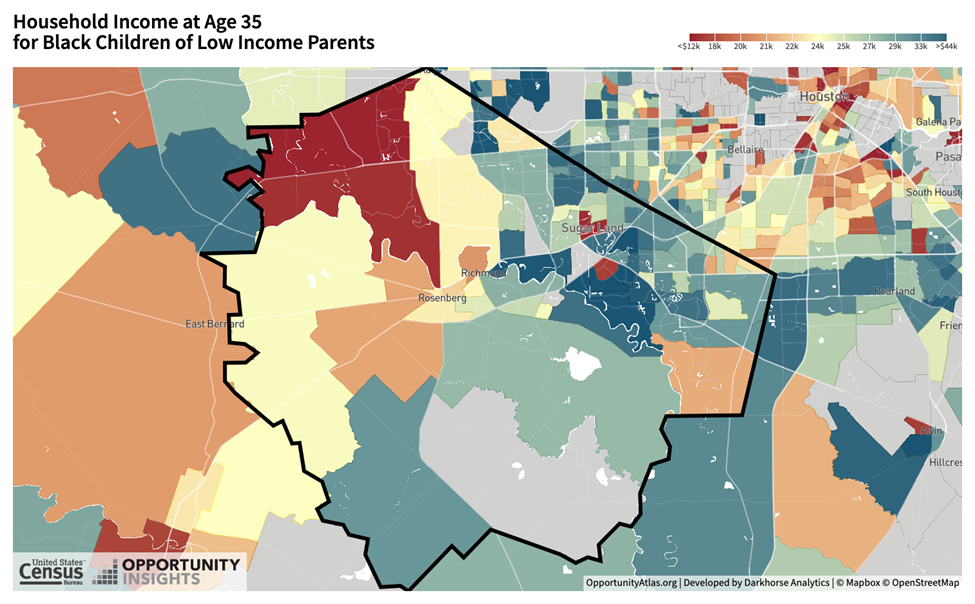
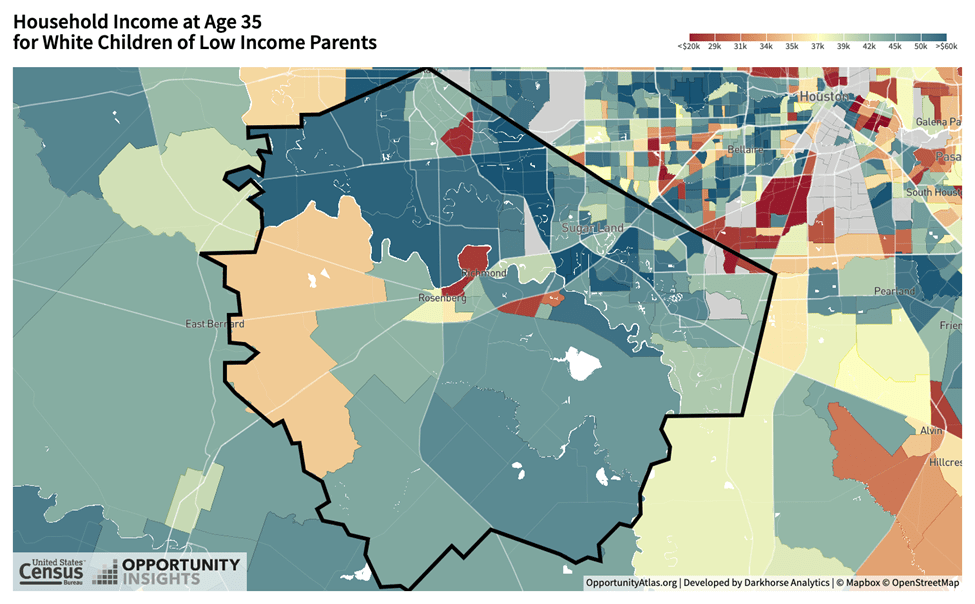
Economic mobility outcomes by race
Economic mobility can affect subgroups in the same neighborhood in different ways, shedding light on some racial and class-based disparities. For example, the average Black child from a low-income family in Fort Bend County earns a household income of $27,000 in adulthood, compared to $44,000 for the average white child from a low-income family. Similarly, a Black child from a low-income family raised in Montgomery County earns a household income of $25,000, compared to a white child from a low-income family making $39,000.
This dataset has also shown downward mobility varies by race. Black boys who grow up in America, even from an affluent family and live in a high-income neighborhood, still earn less in adulthood than white boys with similar backgrounds.25 Moreover, white boys from affluent families are more likely to stay wealthy in adulthood while Black boys from similar families are more likely to become poor rather than retain their socioeconomic status as adults.
Economic mobility trends by race
The newest addition to Opportunity Atlas—the Mobility Trends map—shows that while racial disparities in economic mobility still exist, they have shrunk over time while gaps by income level have widened. This study reveals that the national income gap between white children from low-income (25th percentile) and high-income (75th percentile) households has widened by 30%, while the earnings gap between white and Black children from low-income households has shrunk by the same amount.
However, white children from low-income families still earn, on average, $13,000 more in adulthood than Black children in similar situations. Additionally, the Black-white economic mobility gap narrowed mainly due to improvements in Black children’s chances of moving out of poverty, not their likelihood of reaching the upper class. Black children born into the lowest income quintile in 1978 were 15 times more likely to remain there compared to white children—this gap decreased by 4.1 percentage points for those born in 1992. However, the likelihood of a Black or white child born into a low-income family reaching the top income quintile has not changed.
Our three-county region mirrors national trends with the income gap between white children born to low-income and high-income parents widening by 36% in Fort Bend County, 30% in Harris County, and 18% in Montgomery County. Similarly, the income gap between white and black children from low-income families has decreased by 42% in Fort Bend County, 35% in Harris County, and 31% in Montgomery County. However, disparities persist with a future earnings gap of $7,500 between white and Black children born into low-income families in 1992 in Fort Bend County and a gap of $8,200 in Harris and Montgomery counties.
Helpful Articles from Understanding Houston
References:
- Mullainathan, S., & Shafir, E. (2013). Scarcity: Why having too little means so much. Macmillan.
- Shiv, B., & Fedorikhin, A. (1999). Heart and mind in conflict: The interplay of affect and cognition in consumer decision making. Journal of consumer Research, 26(3), 278-292.
- Belle, D., & Doucet, J. (2003). Poverty, inequality, and discrimination as sources of depression among U.S. women. Psychology of Women Quarterly, 27(2), 101-113. https://doi.org/10.1111/1471-6402.00090
- Shaw KM, Theis KA, Self-Brown S, Roblin DW, Barker L. Chronic Disease Disparities by County Economic Status and Metropolitan Classification, Behavioral Risk Factor Surveillance System, 2013. Prev Chronic Dis 2016;13:160088. DOI: http://dx.doi.org/10.5888/pcd13.160088
- Mode, N. A., Evans, M. K., & Zonderman, A. B. (2016). Race, neighborhood economic status, income inequality and mortality. PLoS ONE, 11(5), e0154535. https://doi.org/10.1371/journal.pone.0154535
- Singh, G. K., & Siahpush, M. (2006). Widening socioeconomic inequalities in US life expectancy, 1980–2000. International Journal of Epidemiology, 35(4), 969–979. https://doi.org/10.1093/ije/dyl083
- Braveman, P. A., Cubbin, C., Egerter, S., Williams, D. R., & Pamuk, E. (2010). Socioeconomic disparities in health in the United States: What the patterns tell us. American Journal of Public Health, 100(Suppl 1), S186–S196. https://doi.org/10.2105/AJPH.2009.166082
- Eamon, M. K. (2001). The effects of poverty on children’s socioemotional development: An ecological systems analysis. Social Work, 46(3), 256–266.
- Justice, L. M., Jiang, H., Purtell, K. M., Schmeer, K., Boone, K., Bates, R., & Salsberry, P. J. (2019). Conditions of poverty, parent-child interactions, and toddlers’ early language skills in low-income families. Maternal and Child Health Journal, 23(7), 971–978. https://doi.org/10.1007/s10995-018-02726-9
- Evans, G. W., & Kim, P. (2013). Childhood poverty, chronic stress, self-regulation, and coping. Child Development Perspectives, 7(1), 43–48. https://doi.org/10.1111/cdep.12013
- Council on Community Pediatrics, Gitterman, B. A., Flanagan, P. J., Cotton, W. H., Dilley, K. J., Duffee, J. H., Green, A. E., Keane, V. A., Krugman, S. D., Linton, J. M., McKelvey, C. D., & Nelson, J. L. (2016). Poverty and child health in the United States. Pediatrics, 137(4), e20160339. https://doi.org/10.1542/peds.2016-0339
- Baydu, M. M., Kaplan, O., & Bayar, A. (2013). Facing the influence of poverty on graduation rates in public high schools. Procedia-Social and Behavioral Sciences, 84, 233-237.
- National Academies of Sciences, Engineering, and Medicine; Division of Behavioral and Social Sciences and Education; Committee on National Statistics; Board on Children, Youth, and Families; Committee on Building an Agenda to Reduce the Number of Children in Poverty by Half in 10 Years; Le Menestrel S, Duncan G, editors. A Roadmap to Reducing Child Poverty. Washington (DC): National Academies Press (US); 2019 Feb 28. 3, Consequences of Child Poverty. Available from: https://www.ncbi.nlm.nih.gov/books/NBK547371/
- Jarjoura, G. R., Triplett, R. A., & Brinker, G. P. (2002). Growing Up Poor: Examining the Link between Persistent Childhood Poverty and Delinquency. Journal of Quantitative Criminology, 18(2), 159–187. http://www.jstor.org/stable/23366800
- Wagmiller Jr, R. L., & Adelman, R. M. (2009). Childhood and intergenerational poverty: The long-term consequences of growing up poor. National Center for Children in Poverty. https://www.nccp.org/publication/childhood-and-intergenerational-poverty/
- Desmond, M. (2023). Poverty, by America. Penguin Books.
- Lin, A. C., & Harris, D. R. (2009). The colors of poverty: Why racial & ethnic disparities persist. Ann Arbor, 1001(48109), 43091. Retrieved from https://npc.umich.edu/publications/policy_briefs/brief16/PolicyBrief16.pdf
- Williams, D. R., Mohammed, S. A., Leavell, J., & Collins, C. (2010). Race, socioeconomic status, and health: Complexities, ongoing challenges, and research opportunities. Annals of the New York Academy of Sciences, 1186(1), 69–101. https://doi.org/10.1111/j.1749-6632.2009.05339.x
- Ratcliffe, Caroline E., and Signe-Mary McKernan. “Child poverty and its lasting consequence.” Urban Institute Low-Income Working Families Working Paper 21 (2012).
- Ratcliffe, Caroline E., and Signe-Mary McKernan. “Child poverty and its lasting consequence.” Urban Institute Low-Income Working Families Working Paper 21 (2012).
- Durand, Casey P., Adriana Garcia, Ryan Holeywell, Kimberly Johnson-Baker, Heather O’Connell, Ethan Raker, and Jie Wu. “Houston’s Opportunity: Reconnecting Disengaged Youth and Young Adults to Strengthen Houston’s Economy.” Rice Kinder Institute for Urban Research (2016).
- Mendelson, T., Mmari, K., Blum, R. W., Catalano, R. F., & Brindis, C. D. (2018). Opportunity Youth: Insights and Opportunities for a Public Health Approach to Reengage Disconnected Teenagers and Young Adults. Public health reports (Washington, D.C. : 1974), 133(1_suppl), 54S–64S. https://doi.org/10.1177/0033354918799344
- Badger, Emily, et al., “Extensive Data shows Punishing Reach of Racism for Black Boys,” The New York Times, March 19, 2018.
- Chetty, Raj, et al. “The Opportunity Atlas: Mapping the Childhood Roots of Social Mobility.” National Bureau of Economic Research, no. w25147 (2018).
- Chetty, Raj, Nathaniel Hendren, and Lawrence F. Katz. “The Effects of Exposure to Better Neighborhoods on Children: New Evidence from the Moving to Opportunity Experiment.” American Economic Review 106, no. 4 (2016): 855-902.
- Badger, Emily, et al., “Extensive Data shows Punishing Reach of Racism for Black Boys,” The New York Times, March 19, 2018.