Vulnerability to and Impacts from Disasters
Exploring unequal effects of natural disasters on Houston communities
Natural disasters have impacted hundreds of thousands of families in Greater Houston over the past 40 years. Non-white and low-income communities are not only more vulnerable to the impacts of disasters but also are disproportionately affected in significant ways.
Why measuring vulnerability to the impacts of natural disasters matters to Houston
Disasters affect people’s lives in many different ways — financially, physically, emotionally and more — and the effects can linger well after the storm passes. However, not everyone is affected in the same way. Research has shown that some populations and communities are disproportionately affected by natural disasters. Just as one’s ability to fight an illness depends a good deal on the health of the individual, a community’s ability to defend itself from negative shocks caused by a disaster largely depends on its economic, demographic and social health before a storm hits. Black, Latino, low-income and immigrant communities are more vulnerable to the stresses and shocks caused by natural disasters — the result of discrimination, economic and racial segregation, disinvestment, and other challenges – both past and present.
The more we understand about which communities are hardest hit by disasters and in what ways, the better job we can do to prioritize resources to strengthen communities before disasters strike.
The data
Social vulnerability to disasters in the Houston area
Before diving into the data on social vulnerability in Houston, let’s define what it means to be socially vulnerable. How does FEMA define vulnerability? FEMA defines social vulnerability as the susceptibility of social groups to the adverse impacts of natural hazards, including disproportionate death, injury, loss, or disruption of livelihood.
The extent to which natural disasters affect households depends largely on their situation before disaster strikes. Non-white, low-income and immigrant families typically report impacts from disasters that are more severe than those experienced by white, higher-income and native-born families. In part, this is because these groups tend to have lower levels and quality of economic and job security, housing stability and conditions, health insurance coverage, and financial windfall, even prior to a disaster. At the same time, the neighborhoods impacted most are those that were established by segregation, are typically located in low-lying areas, and have experienced decades of disinvestment.1 When disaster comes, these challenges are only exacerbated.
The Centers for Disease Control and Prevention’s (CDC) Social Vulnerability Index (SVI) measures the social vulnerability of counties and census tracts on a scale from 0 (indicating the lowest vulnerability) to 1 (highest vulnerability). Research suggests counties with high vulnerability tend to be less resilient to hazards or shocks and have higher levels of human and economic suffering and loss.2 Part of this is associated with the level of access to resources needed to prepare for, cope with and recover from disasters.
Among Houston’s three most populous counties, Harris County’s SVI is the highest at 0.72, meaning that it is more vulnerable to the negative effects of disasters than 72% of counties across the nation. Fort Bend (0.29) and Montgomery (0.39) counties are less vulnerable by comparison. Their overall vulnerability relative to other counties remained relatively flat between 2014 and 2018.
A total of 3.4 million residents — or 58% — in the three-county region live in a census tract with at least medium-high vulnerability (greater than 0.5). In Harris County, almost 3 million residents, or 64% of the population, live in a census tract that is more vulnerable than half the census tracts in the nation. In Fort Bend County, 239,110 residents (32%), and in Montgomery County, 247,766 (45%), live in census tracts with medium-high vulnerability or higher.
View your neighborhood’s Social Vulnerability Index ranking with the map below.
What makes a person vulnerable to disasters?
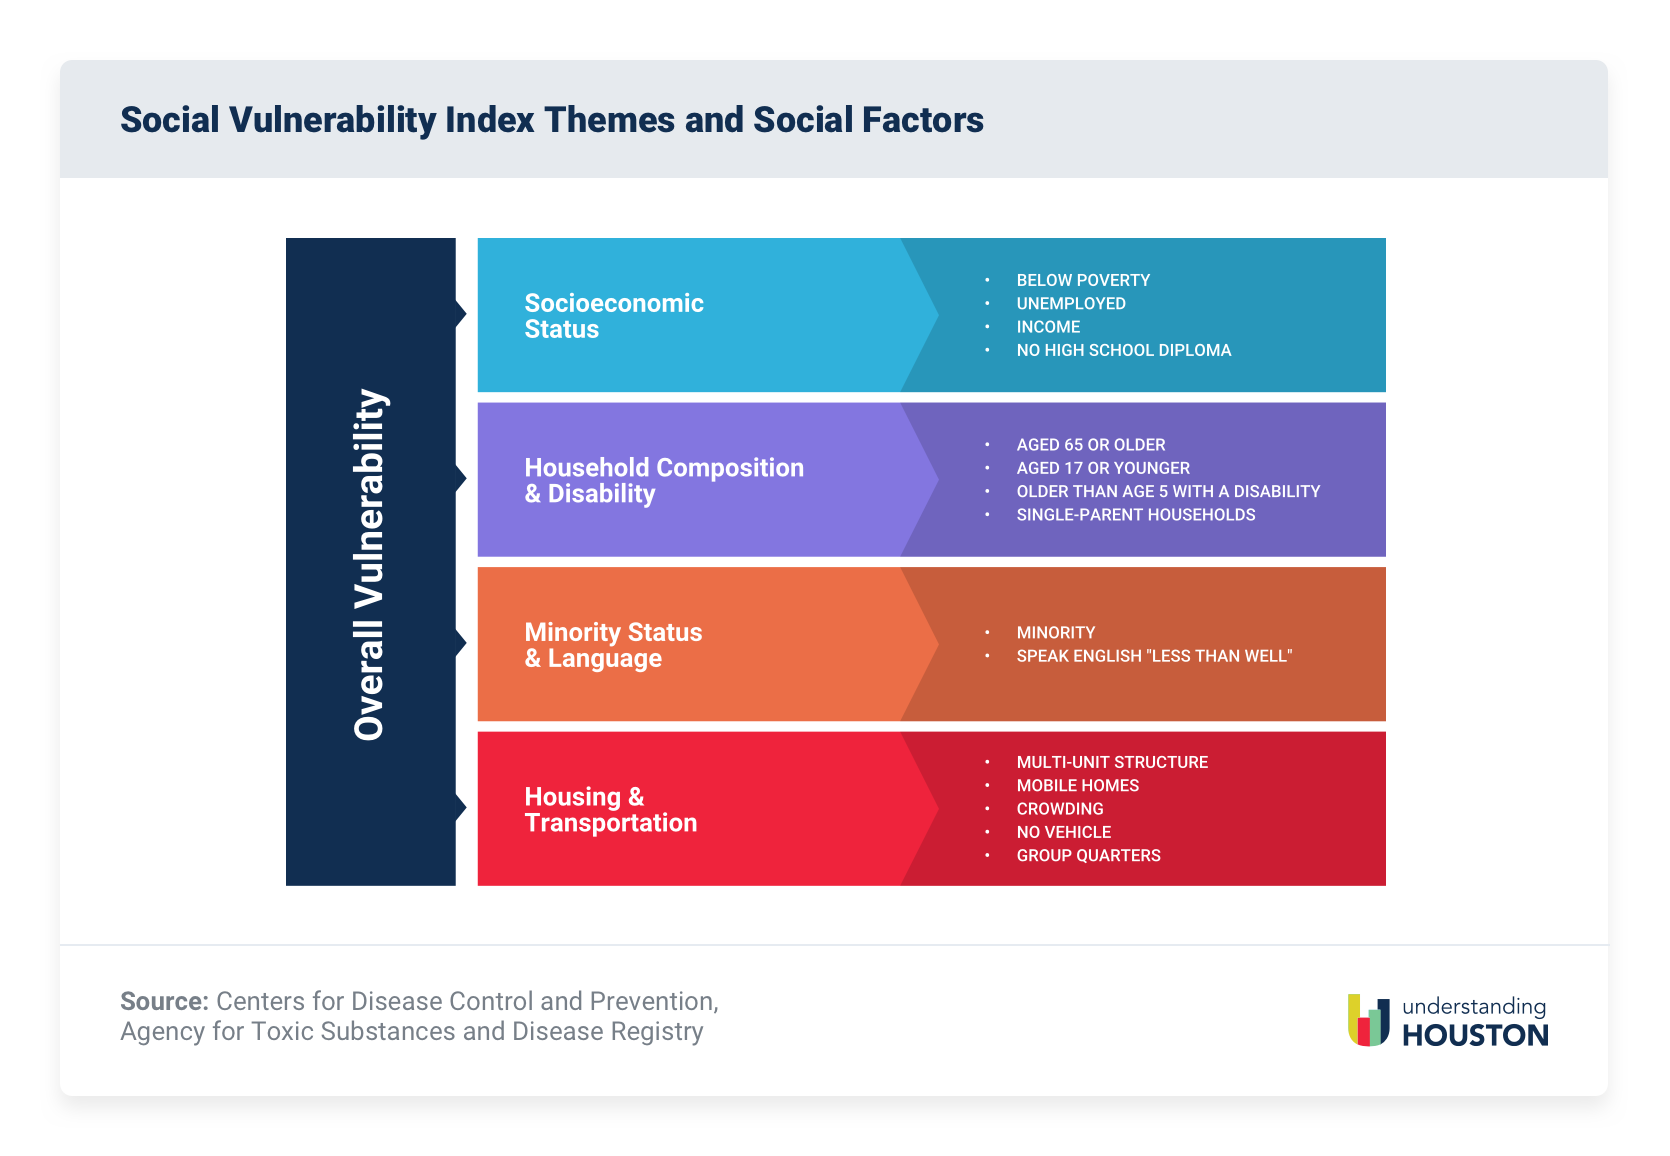
The SVI comprises 15 demographic characteristics and social factors across four themes: socioeconomic status, household composition and disability, non-white status and language, and housing and transportation. Examples of vulnerabilities that increase a community’s SVI (i.e., indicating more vulnerability to impacts from disasters), include higher proportions of residents living in poverty, residents older than 64 years or younger than 18 years, non-white residents, and those with poor housing conditions and unreliable transportation.
One of the strongest determinants of community resilience is income and wealth. Higher-income communities are most likely to have access to resources that mitigate disaster impacts and facilitate recovery, allowing residents to be able to move on from disasters relatively swiftly. However, income is only part of the equation. Families of four that earn the median income for the region can still be economically insecure after incorporating the high costs of housing, transportation and other necessities.
Vulnerable households are more likely to experience food insecurity in times of disaster as food prices increase, food availability diminishes from disrupted supply chains, and public transportation halts. Of course, households with more disposable income that can regularly stock non-perishable goods, hygiene products and water are less likely to feel these impacts.
Fort Bend’s medium-low overall vulnerability index masks the fact that the county’s substantial non-white population could be at higher risk of vulnerability to disaster impacts. Any disaster preparedness plan in Fort Bend County should include protocols to target its residents who are potentially more vulnerable to disaster because of limited English language skills and/or social capital to call upon for help. Montgomery County reports higher social vulnerability than Fort Bend on household composition/disability and housing. Harris County is more vulnerable than the other two counties on all measures.
Read more about disaster relief in Houston.
Financial impacts of disasters in the Houston area
To address urgent basic needs, the Federal Emergency Management Administration (FEMA) provides housing vouchers or cash directly to those affected through its Individual and Household Program (IHP), which is used to cover expenses caused by the disaster, including medical care, dental care, child care, funeral and burial costs, essential household items, clean-up items, moving and storage costs, and vehicle maintenance. Typically, the number of IHP requests from residents to FEMA indicates the scope of impact and need after a disaster.
More than half a million households across the three-county area applied for FEMA assistance in the aftermath of Hurricane Harvey, compared to 104,000 after Hurricane Rita and 442,000 following Hurricane Ike. The majority of those seeking assistance after Hurricane Harvey were renters, whereas more homeowners sought assistance after Hurricane Ike. The number of households seeking assistance after floods and tropical storms is smaller than after hurricanes, and homeowners typically make up the majority of requests.
However, not all households that request assistance from FEMA receive it. Low-income households are less likely to receive government assistance.3 One reason for this is that FEMA uses the home’s value before the disaster to determine the level of assistance. If homes have “substantial damage” after the storm combined with “pre-existing” conditions, they are less likely to receive funding for repairs.
The approval rate in the three-county area rarely rose above 50% for most disasters occurring since 2005, and homeowners were more likely to be approved than renters in seven of the last nine disasters. Approval rates for both homeowners and renters are lower in Harris County than in Fort Bend or Montgomery counties.
Three out of five Harris County residents reported financial challenges after Hurricane Harvey, according to a survey conducted one year after the storm by the Episcopal Health Foundation in partnership with the Kauffman Family Foundation. About 51% of white residents experienced financial struggles, compared to nearly 64% of Latinos and 75% of Black residents. One year later, 31% of Black respondents reported being in a worse financial position, compared to 25% of whites, as a result of the hurricane.
Housing impacts of disasters in the Houston area
FEMA provides data on the average cost of damage homeowners experience after disasters, regardless of whether the agency provides financial assistance to rebuild or repair.
Homeowners in the three-county region experienced damage at an average cost of $8,937 after the Memorial Day Flood in 2016, which caused the most damage to homeowners in Fort Bend County. Montgomery County homeowners experienced the most damage from the 2016 Memorial Day Flood and Tropical Storm Imelda. The average damage in Harris County was highest for Tropical Storm Erin and the 2016 Memorial Day Flood.
Slightly more than 8% of Harris County respondents who were displaced by Hurricane Harvey were still living in a temporary shelter a year later, according to the Episcopal Health Foundation Survey. Many returned home to find an unlivable space and reported their current living conditions were not safe. Nearly three out of 10 households with incomes less than 200% of the Federal Poverty Level (FPL) cited unsafe living conditions, compared to one in 10 households with higher incomes. Hispanic residents of the 24-county area also reported higher rates of unsafe living conditions due to damage from Hurricane Harvey.
Environmental impacts of disasters and public health in the Houston area
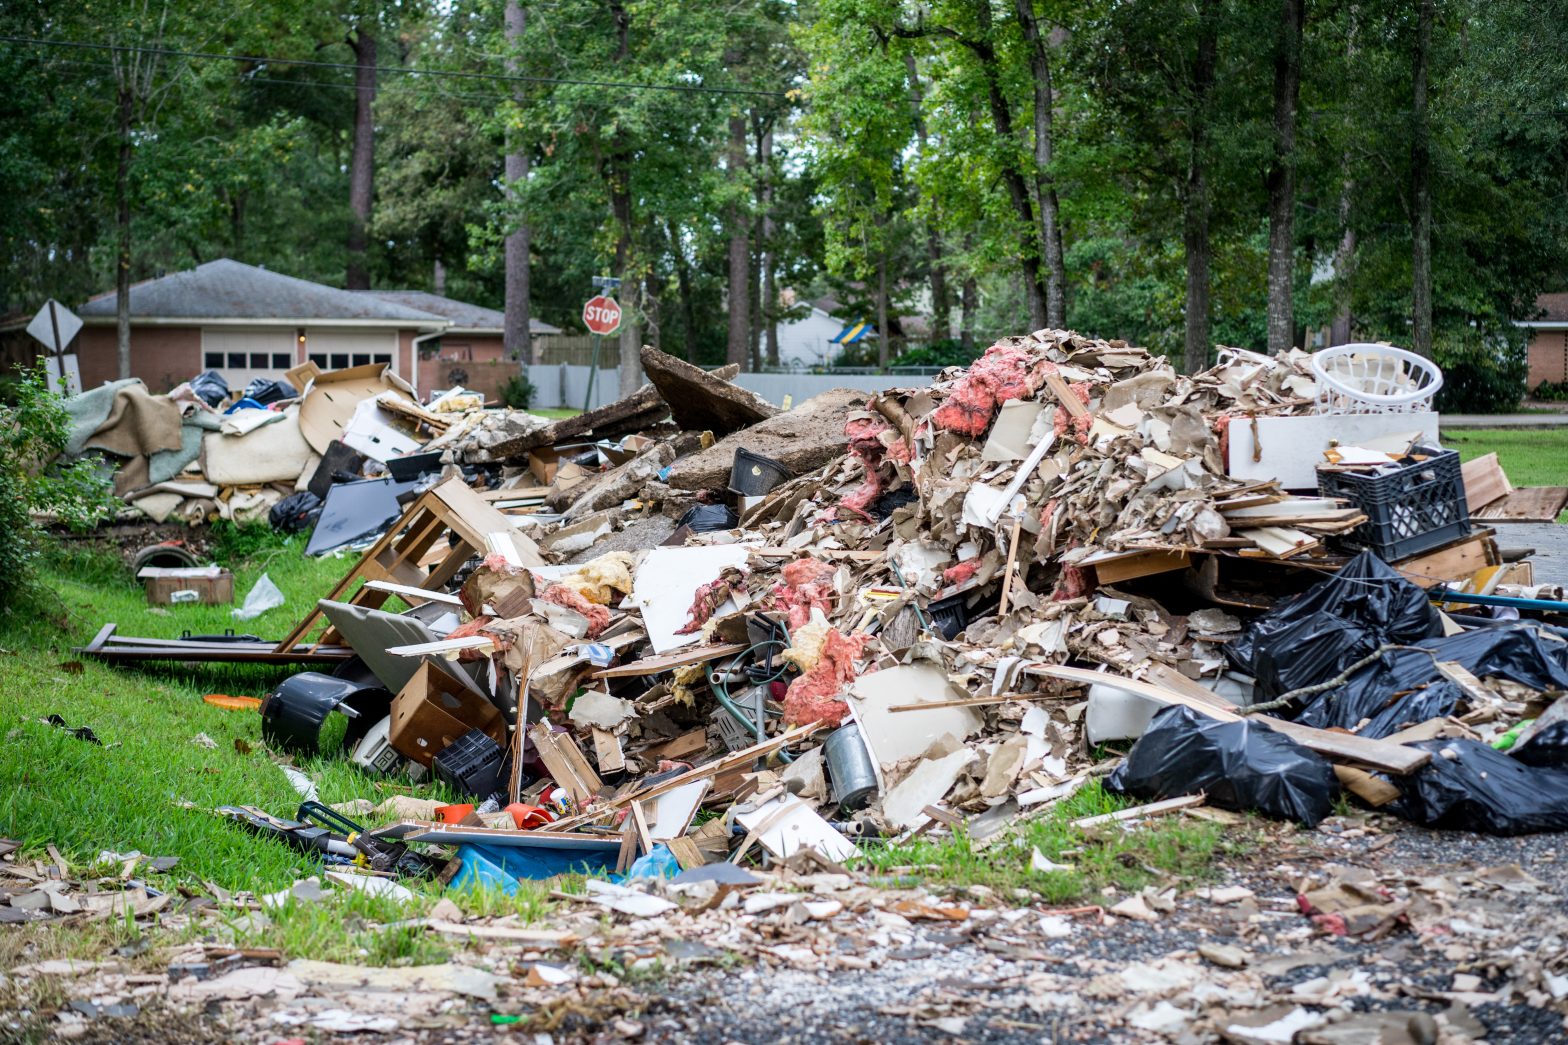
Environmental impacts from flooding and other natural disasters in Houston’s three-county region can have significant effects on public health, both short-term and long-term. Sewage, debris and chemicals mix with flood waters.4 Chemicals known to be carcinogenic and gasses that worsen respiratory problems are released into the soil, water and air.
Water Quality
Rising water levels, flooding and heavy rainfall can carry pollutants into water bodies, residential homes and potable water supply.5 Sewage plants, for instance, are often located in low-lying areas, and are susceptible to flooding.6 When these plants or streets flood, sewage discharges into the flood water. The same happens when refineries and chemical plants are flooded — industrial waste from factories mixes with the flood water.7 Contaminated flood water flows into streets, streams and rivers, and also infiltrates groundwater.
During Hurricane Harvey in August 2017, thousands of gallons of sewage mixed with the one trillion gallons of rain dumped on the region, resulting in high levels of E. coli contamination in local bayous and creeks, neighborhood streets, and residents’ living rooms.8 The map below shows the results for 37 water samples, taken between September 4 — 11, 2017 from surface water, flood water, and the interior of homes across Harris County.
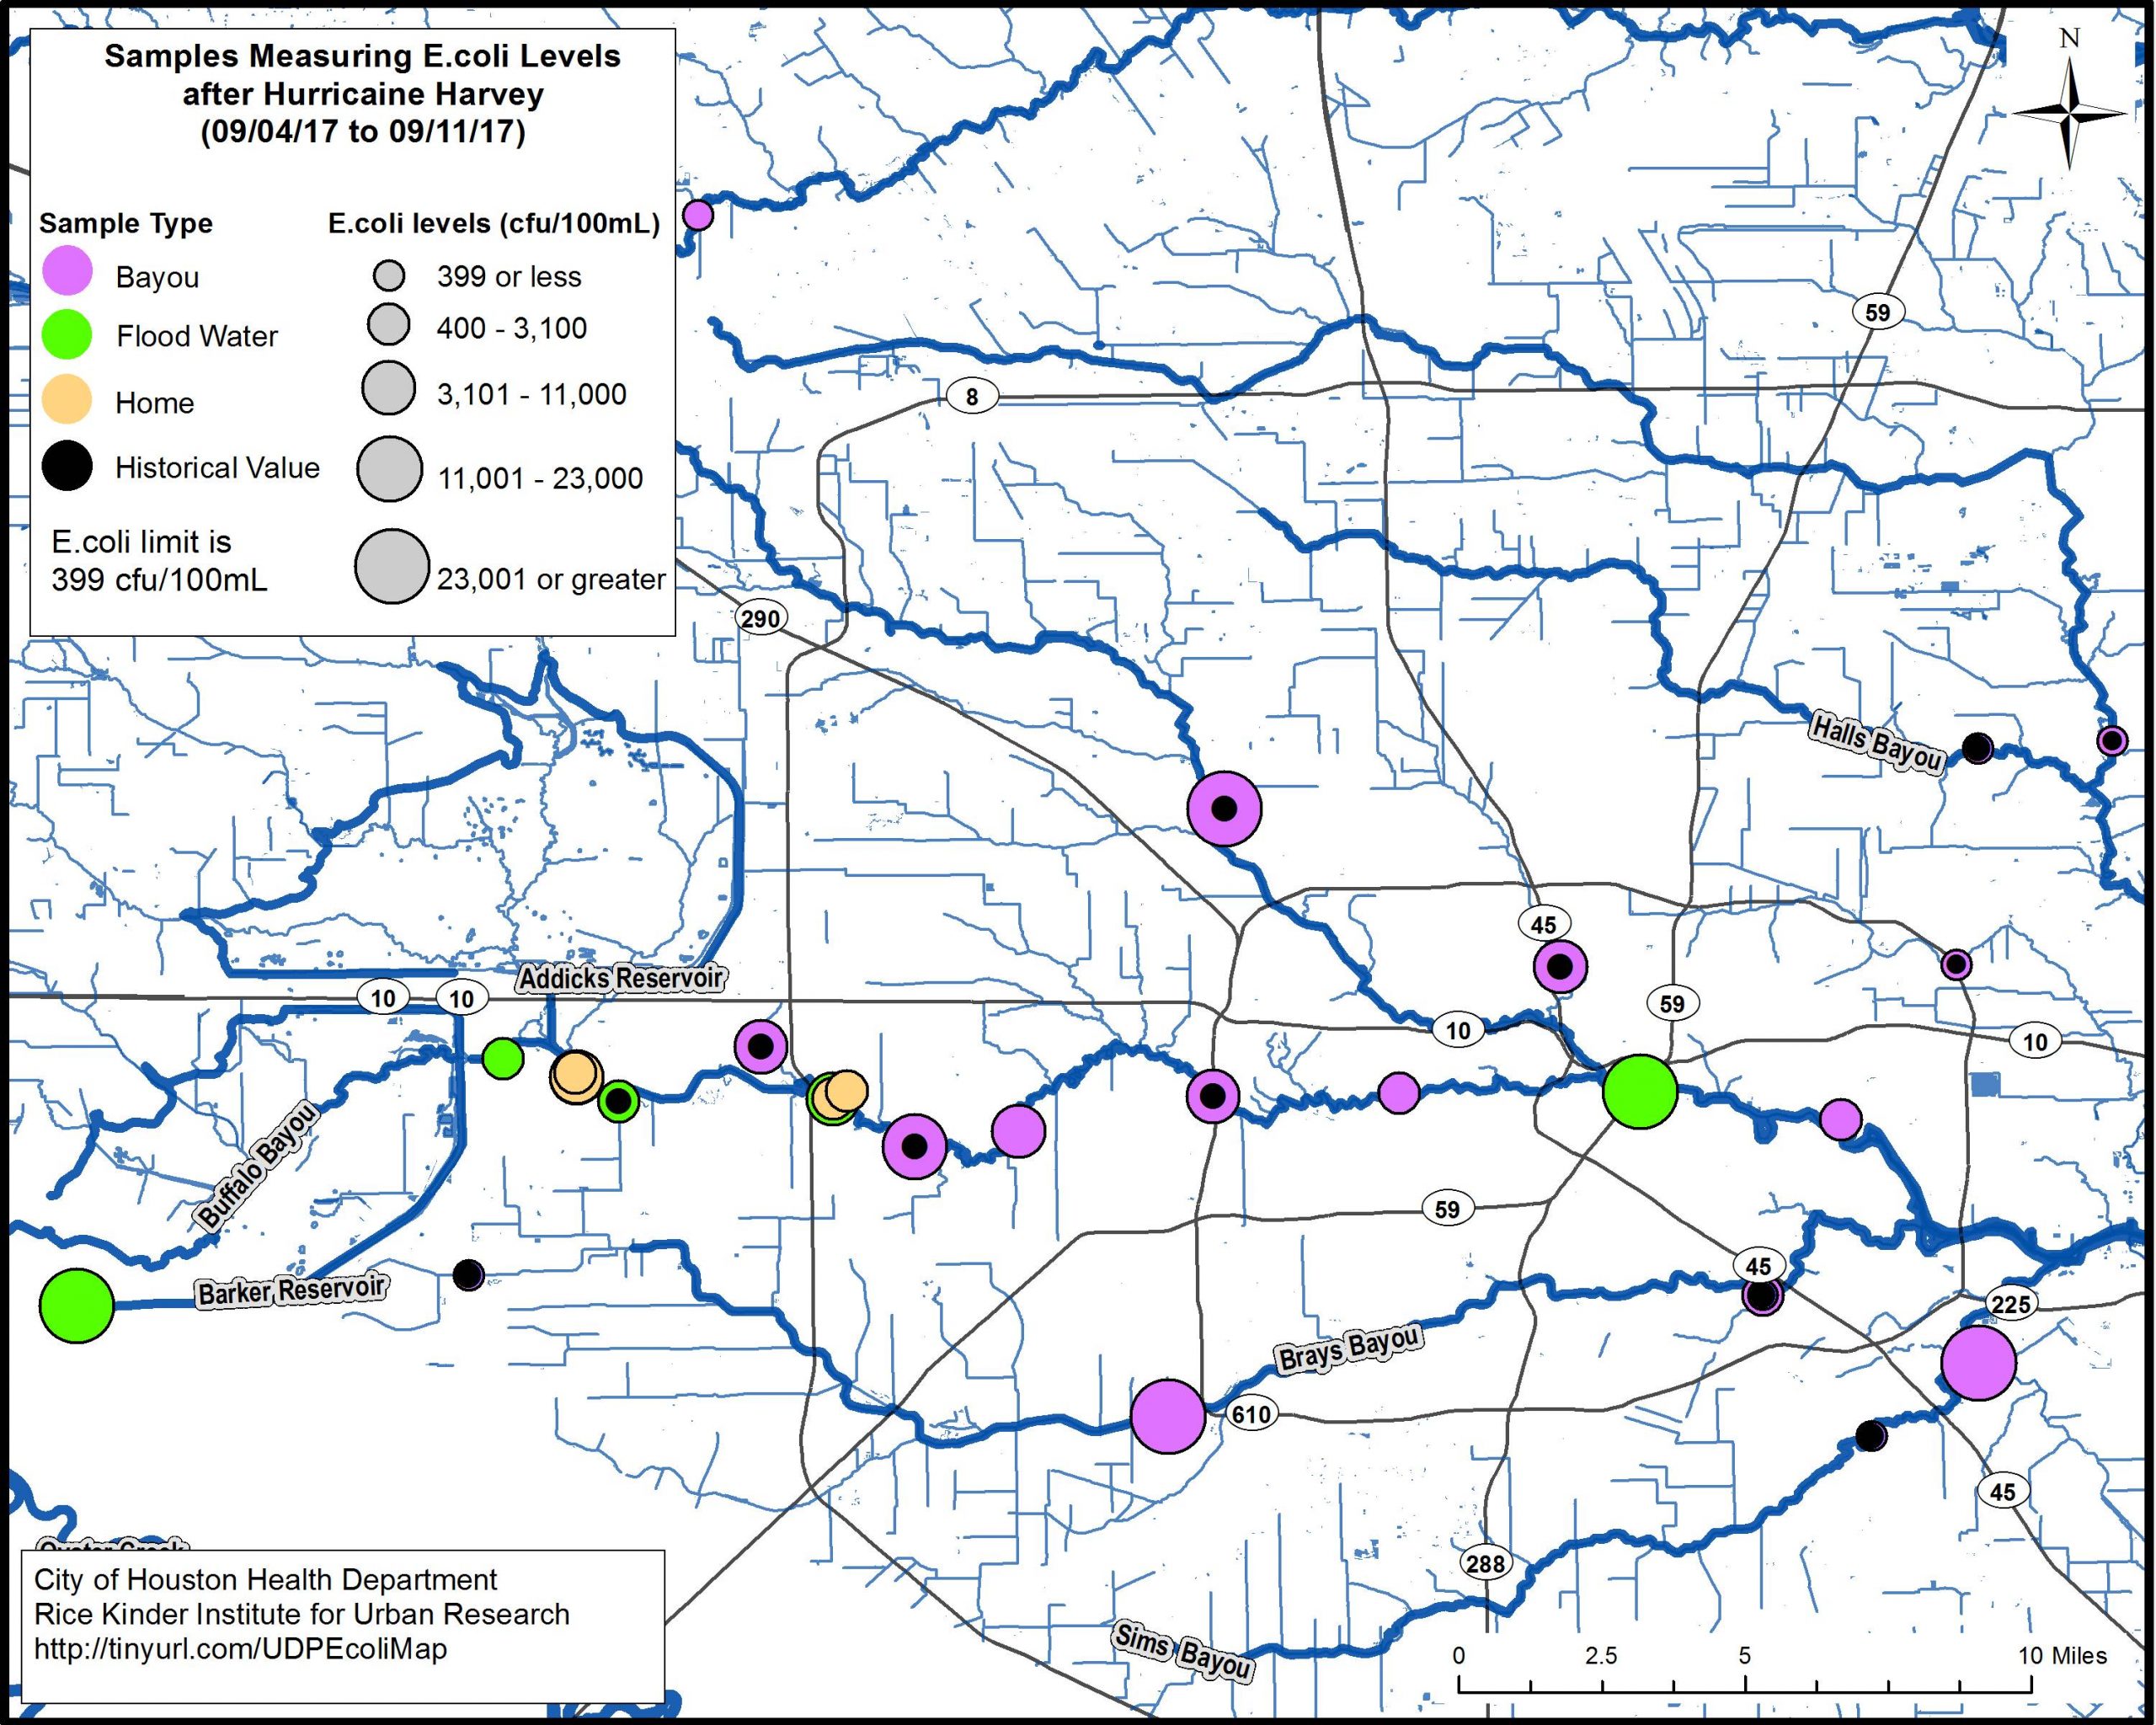
E. coli levels were much lower before Harvey (denoted by black circles), indicating the significant impact hurricanes and flooding can have on water quality. Large purple, green, and yellow circles indicate post-Harvey E. coli levels far greater than the limit set by Texas Commission on Environmental Quality (TCEQ). In some cases, contamination levels were more than 57 times above the acceptable limit. This is especially evident along Buffalo Bayou and in Southeast Houston outside the 610 Loop where levels were far above the limit (23,000 cfu/100mL or greater as opposed to the limit of 399 cfu/100mL).
Air Quality
Air pollution in the greater Houston area can worsen during major storms and hurricanes as oil refineries and chemical plants often conduct emergency shutdowns in preparation and then restart systems after the storm passes. This process involves burning excess fuels and chemicals in the pipelines which emits volumes of pollution into the air. At the same time, air quality monitoring has often been suspended in anticipation of a major storm to prevent equipment damage and can take days to get back online. This makes it difficult to track the exact amount of air pollution emitted during a storm.
Industrial facilities in Greater Houston generated an additional 340 tons of toxic air pollution during Hurricane Harvey because of shutdowns, restarts and malfunctions.9 This figure is likely an undercount since facilities self report the data and it includes only 13 of nearly 400 major industrial facilities operating in Harris and Jefferson counties, according to the Environmental Protection Agency.
Houston Advanced Research Center mapped the environmental impacts of Hurricane Harvey in 2017 and found significant increases in water and air pollution in the region.
Public Health
The cumulative effect of environmental hazards such as contaminated water and air can negatively affect one’s health immediately after a natural disaster and for an extended period of time afterward. Ingesting contaminated water can make us sick and a surge in air pollution can precipitate or aggravate respiratory conditions — or worse in more severe cases.
Not all physical health conditions that present after a natural disaster are caused by polluted water and air. Residents whose homes flood face unique hazards such as mold exposure or adverse effects sustained during clean-up activities. Mold typically grows on damp surfaces within 24 to 48 hours — and even faster in humid climates.10 Mold exposure affects everyone differently depending on the type and level, but typical symptoms include respiratory problems, nasal/sinus congestion and eye, nose, throat irritation.
After Hurricane Harvey, the Texas Flood Registry found that 63% of respondents experienced at least one negative health symptom such as runny nose, headaches/migraines, problems concentrating, shortness of breath, or skin rash. For the two storms surveyed after Harvey — the May 2019 storms and Tropical Storm Imelda — the results were less severe. Tropical Storm Imelda resulted in negative health symptoms for 9% of respondents, while 8% experienced negative health symptoms after the May 2019 storms.
Low-income communities in predominantly-Black and Latino neighborhoods are disproportionately subjected to environmental hazards and resulting public health problems.11 Communities of color and low-income residents are more likely to reside in Houston areas that flood or contain petrochemical plants because of historical discriminatory housing policies, such as redlining, among other factors.12 These neighborhoods also tend to lack effective wastewater infrastructure, exacerbating flooding risks. As more-intense storms are forecasted, health risks will only increase for Houstonians.
Mental health impacts of disasters in the Houston area
In addition to negative physical health outcomes, disasters hurt residents’ mental health.13
Nearly one-third of Harris County residents experienced negative effects on their mental health after Hurricane Harvey, according to the Episcopal Health Foundation Harvey survey.14 Black residents were most likely to report experiencing negative mental health. And individuals with lower incomes experienced more mental health distress than their higher-income counterparts. To make matters worse, only a small proportion received mental health services in the year following the storm. Latinos were least likely to receive help for mental health distress.
For recent, less intense storms, the Texas Flood Registry still found negative emotional impacts. In the three-county area, 27% of respondents to the Tropical Storm Imelda survey experienced negative emotional changes, while 20% also experienced negative mental health outcomes as a result of the May 2019 storms. An overwhelming majority of respondents in both surveys indicated that their mental health change was due to their experiences during Hurricane Harvey. In other words, mental health outcomes are tied to previous disaster experiences and have a long-term effect. Each new storm may exacerbate negative mental health outcomes from previous storms.15
The mental health impact of exposure to disasters, however, is not limited to storms. In mid-December 2021, almost two years after the arrival of COVID in Houston, more than 20% of Houston MSA residents reported that they felt nervous, anxious or on edge for at least more than half the days of a week.
Helpful Articles by Understanding Houston:
- Houston is Generous
- Houston is Resilient
- Houstonians’ Experiences with Hurricane Harvey and the COVID-19 Pandemic
- After Six Federal Disasters in Five Years, Why Do We Not Fully Prepare?
- Houston is Big
References:
- Smiley, K.T. (2020). Social inequalities in flooding inside and outside of floodplains during Hurricane Harvey. Environmental Research Letters, 15(9). https://doi.org/10.1088/1748-9326/aba0fe
- Bergstrand, K., Mayer, B., Brumback, B., & Zhang, Y. (2015). Assessing the Relationship Between Social Vulnerability and Community Resilience to Hazards. Social Indicators Research, 122(2), 391–409. https://doi.org/10.1007/s11205-014-0698-3
- National Low Income Housing Coalition. (2020). Fixing America’s Broken Disaster Housing Recovery System. https://nlihc.org/sites/default/files/Fixing-Americas-Broken-Disaster-Housing-Recovery-System_P1.pdf
- Chakraborty, J., Collins, T.W., & Grineski, S. E. (2019, February 1). Exploring the Environmental Justice Implications of Hurricane Harvey Flooding in Greater Houston, Texas. American Journal of Public Health 109, no. 2: pp. 244-250. https://doi.org/10.2105/AJPH.2018.304846
- UNC- Asheville Environmental Quality Institute. (2006, January). Assessment of Water Quality Impacts of Hurricanes in Western North Carolina Through Strategic Monitoring and Statistical Analysis (Technical Report No. 06-153). http://www.environmentalqualityinstitute.org/vwin/pdf/Hurricane-Project-EQI.pdf
Schaffer-Smith, D., Myint, S. W., Muenich, R. L., et. al. (2020). Repeated Hurricanes Reveal Risks and Opportunities for Social-Ecological Resilience to Flooding and Water Quality Problems. Environmental Science & Technology, 54 (12), 7194-7204. https://doi.org/10.1021/acs.est.9b07815 - Yu, P., Zaleski, A., Li, Q., He, Y., Mapili, K., Pruden, A., Alvarez, P. J. J, & Stadler, L. B. (2018). Elevated Levels of Pathogenic Indicator Bacteria and Antibiotic Resistance Genes after Hurricane Harvey’s Flooding in Houston. Environmental Science & Technology letters, 5, 481-486. https://doi.org/10.1021/acs.estlett.8b00329
- National Oceanic and Atmospheric Administration. (2019, February). Watersheds, flooding, and pollution. https://www.noaa.gov/education/resource-collections/freshwater/watersheds-flooding-and-pollution
- Texas Commission on Environmental Quality. (2017, December). Wastewater: Hurricane Harvey Related Sanitary Sewer Overflows and Other WW Discharges. https://www.tceq.texas.gov/assets/public/response/hurricanes/sso-ww.pdf
- U.S. Environmental Protection Agency. (2019, December). EPA Needs to Improve Its Emergency Planning to Better Address Air Quality Concerns During Future Disasters (Report No. 20-P-0062). https://www.epa.gov/sites/production/files/2019-12/documents/_epaoig_20191216-20-p-0062.pdf
- U.S. Federal Emergency Management Administration. Dealing With Mold and Mildew in your Flood Damaged Home. https://www.fema.gov/pdf/rebuild/recover/fema_mold_brochure_english.pdf
- Joint Center for Political and Economic Studies, Health Policy Institute. (2008). Environmental justice through the eye of Hurricane Katrina. https://inequality.stanford.edu/sites/default/files/media/_media/pdf/key_issues/Environment_policy.pdf
Villalón, J. (2020, September 18). Flooding Disproportionately Impacts People of Color. Bayou City Waterkeeper. https://bayoucitywaterkeeper.org/flooding-disproportionately-impacts-people-of-color/ - Flores, A. B., Collins, T. W., Grineski, S. E., & Chakraborty, J. (2020). Disparities in Health Effects and Access to Health Care Among Houston Area Residents After Hurricane Harvey. Public Health Reports, 135(4), 511–523. https://doi.org/10.1177/0033354920930133
- Stanke, C., Murray, V., Amlôt, R., Nurse, J., & Williams, R. (2012). The effects of flooding on mental health: Outcomes and recommendations from a review of the literature. PLoS currents, 4, e4f9f1fa9c3cae. https://doi.org/10.1371/4f9f1fa9c3cae
- Experienced any of the following since and as a result of Harvey: They have had a harder time controlling their temper; Their mental health has gotten worse; They started taking a new prescription medicine for problems with mental health; or Their use of alcohol increased.
- Lowe, S. R., McGrath, J. A., Young, M. N., Kwok, R. K., Engel, L. S., Galea, S., & Sandler, D. P. (2019). Cumulative Disaster Exposure and Mental and Physical Health Symptoms Among a Large Sample of Gulf Coast Residents. Journal of Traumatic Stress, 32(2), 196–205. https://doi.org/10.1002/jts.22392