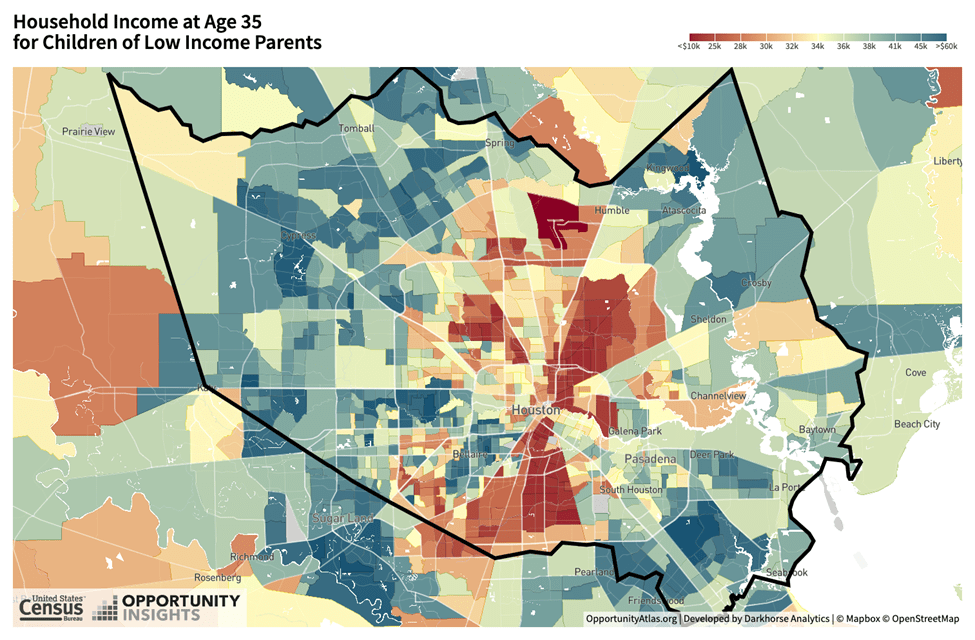
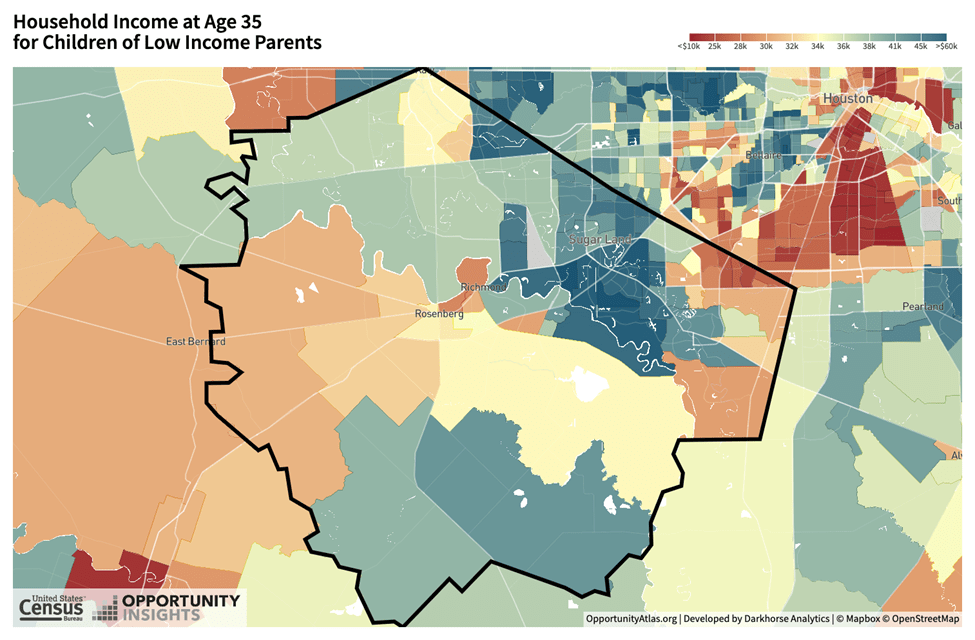
An indicator correlated with many life outcomes, educational attainment profoundly affects individual and regional prosperity
Though the average Houstonian has more education than they did 10 years ago, significant disparities across race/ethnicity persist.
Why educational attainment matters to Houston
The benefits of obtaining an education beyond the 12 mandatory years extend not only to earning potential, health, and quality of life, but also to the collective well-being and economy of our region, and—potentially—future generations. People with a bachelor’s degree have lifetime average earnings that are $1.3 million higher than those with a high school diploma only.1,2 They also enjoy the lowest unemployment rates. Adults with stable, well-paying jobs are less likely to rely on the social safety net (nutritional assistance, subsidized housing, etc.) and less likely to interact with the criminal legal system.3 People with higher education tend to be healthier and live longer.4,5,6 Regions that are home to highly-skilled and educated workers attract and keep employers that provide good jobs, which attract additional skilled workers, fueling the cycle. A region thrives with revenue from additional investment and a growing population of skilled workers. People with higher education are also more likely to vote,7,8 which advances civic engagement in the region. Becoming the first person in a family to earn a college degree can positively affect the trajectory of their and their family’s lives, potentially for future generations.9
However, only a minority successfully walk through this door of opportunity for myriad reasons. This is partly because of discriminatory practices that have existed since our nation’s founding (such as redlining and segregation), exacerbated by present-day disparities (poverty, disinvestment in public schools). Compounded over generations, the result is educational attainment levels that vary significantly by race/ethnicity.
The more we work to improve overall levels of educational attainment — and eliminate disparities — the closer we get to a more vibrant region with opportunity for all.
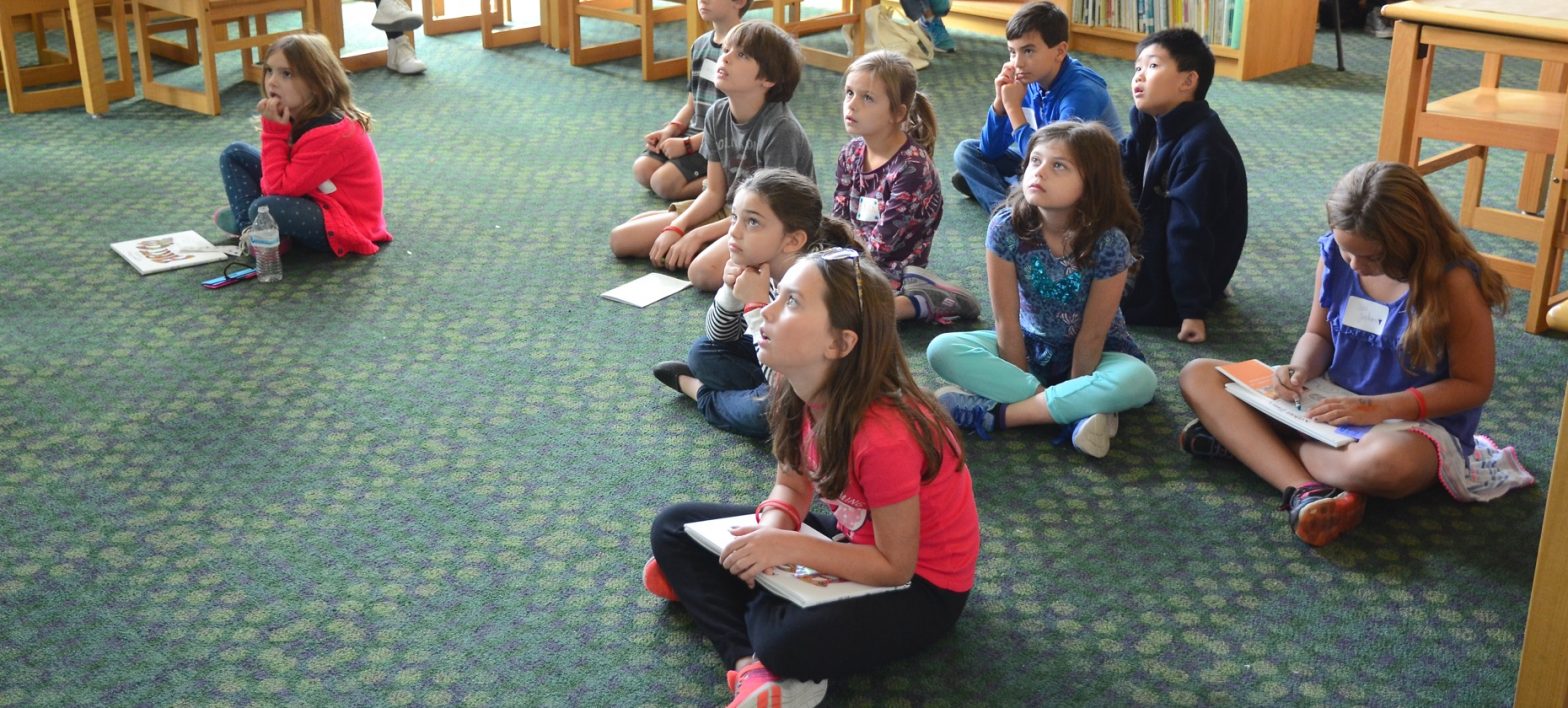
What does educational attainment mean? Educational attainment refers to the highest level of education an individual has completed. As the shift continues toward a knowledge-based economy, higher levels of educational attainment have become increasingly important to social mobility.10 This doesn’t mean a bachelor’s degree is always necessary to secure a “good job,” but some kind of education beyond high school (also called post-secondary education) — such as a certificate, credential, apprenticeship, or associate degree — is critical to meeting the demands of the current workforce and to unlock future individual opportunities.
For at least the last three decades, workers with higher educational attainment have the lowest unemployment rates—even during times of economic downturn such as the aftermaths of the Great Recession in 2008 and the COVID-19 pandemic in 2020. Additionally, during these economic crises, the unemployment rate tends to fluctuate less for those with more educational attainment. Between 2019 and 2020, the national unemployment rate for workers with a bachelor’s degree increased by 2.7 percentage points while the increase for those without a high school diploma was more than double that with a 6.5-point increase. As of 2024, the unemployment rate across the country for those with a bachelor’s degree was 2.3% compared to 4.2% for those with a high school diploma only and 6.2% for those without a high school diploma. Not only are lower education levels associated with higher unemployment, they are also associated with lower annual earnings and lower lifetime average earnings.11
In 2024, the national unemployment rate for workers without a high school diploma was more than double the unemployment rate for those with a bachelor’s degree or higher.
Educational attainment rates in the region continue upward trend, but with significant racial/ethnic disparities
Educational attainment in Texas lags behind the nation. The state of Texas ranks second to last nationwide in the percentage of residents with at least a high school diploma at 86.3%, compared to the national average of 89.8%. Educational attainment levels in Harris County are lower than the state average, with 83.2% of adult residents having a high school diploma. Fort Bend and Montgomery counties fare better than the state and national averages at 92.2% and 89.7%, respectively.
Texas also ranks low in the percentage of the population over the age of 25 with bachelor’s degrees. About one out of three Texans (34.2%) have a bachelor’s degree or above — placing the state 28th among all states and the District of Columbia (D.C.) — compared to 36.2% at the national level. Nearly half of all adults in Fort Bend County have earned a bachelor’s degree (49.4%), the highest attainment rate in the three-county region. If Fort Bend County were a state, it would rank second in the nation — just behind D.C. (65.9%) and ahead of Massachusetts (47.8%). The proportion of adults without a high school diploma is highest in Harris County (16.8%). Adults in Montgomery County are most likely among the three counties to have some college education without a four-year degree (27.9%).
If Fort Bend County were a state, it would rank second in the country with the highest percentage of adults with a bachelor’s degree.
Educational attainment beyond high school has been increasing, however. Between 1990 and 2023, the percentage of adults without a high school diploma decreased by 14.6 percentage points across the U.S., 14.2 points in Texas, and 9.8 points in the three-county area.
Across the Houston region, the share of adults 25 years and older without a high school diploma has also steadily declined, but gaps remain between counties. Harris County has consistently had the highest percentage of residents aged 25 and older without a high school diploma. While its rate was once below the Texas average, it has surpassed the state since 2000. As of 2023, 16.8% of Harris County adults lack a high school diploma, compared to 13.7% statewide. Still, Harris County has made progress, with an 8.3-percentage-point decrease since 1990. Montgomery County has seen the largest improvement, cutting its rate by 14.2 points to 10.3% in 2023—nearly matching the national average of 10.2%. Fort Bend County, which has consistently had the region’s lowest share of adults without a diploma, also saw significant gains, decreasing by 11.3 points over the same period.
Additionally, between 1990 and 2023, the share of residents with bachelor’s degree or higher saw the greatest increase improving by 19.2 percentage points in Fort Bend County, 8.8 points in Harris, and 19.9 points in Montgomery County.
Educational attainment rates are unequal across race, ethnicity and gender
Because of a lengthy history of discriminatory practices since the nation’s founding, which have been exacerbated by present-day imbalances, levels of educational attainment in the United States vary greatly by race/ethnicity. The three-county region is no exception, and these disparities are the direct and intended result of harmful policies, compounded over decades and are not related to any group’s intrinsic talents or priorities.
Asian Americans — a group of people originating from about 50 different countries with distinct political and immigration histories — report the highest levels of education at the national, state, and regional levels. However, it is important to note that there is significant variation even within this large population. According to a 2025 report from the Pew Research Center, 77% of Indian Americans and 58% of Chinese Americans have a bachelor’s degree, while only 20% of Bhutanese and 18% of Laotians do. Chinese (22%) and Indian (21%) Americans make up the largest Asian-American origin group in the United States. Comparatively, Bhutanese and Laotians make up about 1% of the population each. This difference contributes to the high levels of educational attainment for Asian Americans in the state.
In Fort Bend County, 43.5% of Black adults have a bachelor’s degree or higher — 17 percentage points higher than the national average for Black adults (26.3%). However, that figure falls to 29.4% in Harris County, a rate on par with that of Texas overall, according to 2023 estimates.
Consistent with national trends, Hispanic/Latino adults in the Houston area report lower levels of educational attainment. In all three counties, Hispanics have the highest proportion of those without a high school diploma at 18.2% in Fort Bend County, 32.4% in Harris County, and 27.4% in Montgomery County . For comparison, the national average is 26.6%.
Because the general terms “Hispanic” or ”Latino” are used to describe a group of people who originate from a wide variety of Spanish-speaking or Latin American countries, and who understand their identity in different ways, the diversity within that broad group can often go unnoticed. Similar to Asian Americans, the educational attainment varies within this broader group. The latest data available from the Pew Research Center shows that 57% of Venezuelans and 46% of Argentines have at least bachelor’s degree compared to 13% of Salvadorans and 11% of Guatemalans.
As educational attainment levels within each racial/ethnic group have increased in the three-county area, so have high school diploma attainment rates. Between 2000 and 20123, the percentage of residents in Fort Bend and Harris counties with a high school diploma increased the most for Hispanics, rising by 26.7 and 25.0 percentage points, respectively. In Montgomery County, Black residents with a high school diploma increased by 24.1 points.
In 2005, for the first time in the nation’s history, women were more likely than men to have an education beyond a high school diploma. By 2023, across the United States, 66.0% of women had some post-secondary education compared to 61.5% of men.
In 2005, for the first time in the nation’s history, women were more likely than men to have an education beyond a high school diploma.
We see the trend of women being more likely to pursue and attain higher education in Houston’s three-county region and in Texas overall.
Across Texas in 2000, women lagged behind men in the share of the population with a post-secondary education. However, by 2010, the share of women in the state with post-secondary education matched that of men. As of 2023, 63.9% of women in Texas have postsecondary education compared to 60.3% of men. Women have continued their progress in postsecondary educational attainment, increasing 14.1 percentage points between 2000 and 2019 compared to an 8.3-percentage-point increase among men. These statewide trends are also seen in Fort Bend, Harris, and Montgomery counties.
There are, of course, differences across age, gender, race/ethnicity, and occupation.
Carnevale, A. P., Cheah, B., & Rose, S. J. (2021). The College Payoff: More Education Doesn’t Always Mean More Earnings. Georgetown University Center on Education and the Workforce. Retrieved from https://cew.georgetown.edu/cew-reports/the-college-payoff/.
Raghupathi, V., Raghupathi, W. The influence of education on health: an empirical assessment of OECD countries for the period 1995–2015. Arch Public Health 78, 20 (2020). https://doi.org/10.1186/s13690-020-00402-5
Zajacova, A., & Lawrence, E. M. (2018). The Relationship Between Education and Health: Reducing Disparities Through a Contextual Approach. Annual review of public health, 39, 273–289. https://doi.org/10.1146/annurev-publhealth-031816-044628
Roy, B., Kiefe, C. I., Jacobs, D. R., Goff, D. C., Lloyd-Jones, D., Shikany, J. M., Reis, J. P., Gordon-Larsen, P., & Lewis, C. E. (2020). Education, Race/Ethnicity, and Causes of Premature Mortality Among Middle-Aged Adults in 4 US Urban Communities: Results From CARDIA, 1985-2017. American Journal of Public Health, 110(4), 530–536. https://doi.org/10.2105/AJPH.2019.305506
Milligan, K., Moretti, E., & Oreopoulos, P. (2004). Does education improve citizenship? Evidence from the United States and the United Kingdom. Journal of Public Economics,88(9–10), 1667–1695.
Sondheimer, R. M., & Green, D. P. (2010). Using experiments to estimate the effects of education on voter turnout. American Journal of Political Science,54(1), 174–189.
Georgetown University Center on Education and the Workforce, Three Educational Pathways to Good Jobs: High School, Middle Skills, and Bachelor’s Degree, 2018. Retrieved from https://cew.georgetown.edu/cew-reports/3pathways/.
Carnevale, A. P., Cheah, B., & Rose, S. J. (2021).
Pre-K and kindergarten enrollment rates rebound in Fort Bend and Montgomery counties after pandemic losses, but Harris County still lags.
Following sharp declines during the height of the COVID-19 pandemic, early childhood education enrollment in Fort Bend and Montgomery counties has not only rebounded but now exceeds pre-pandemic levels. In contrast, Harris County has yet to recover, continuing a decade-long trend of declining enrollment in early education programs.
Why early childhood education matters to Houston
What is early childhood education? Early childhood education refers to the learning period between birth and five years of age. Established research has found the period from birth to five is the most critical for brain development, and early childhood education reaches children at this meaningful point in their cognitive and social development. Student learning during this time period is linked to future academic accomplishments and is especially important for children classified as being English learners, having a learning disability, or being economically disadvantaged.1
Research has shown that high-quality early childhood education programs help children learn language, mathematics, and social skills, with studies showing up to $17 returned in social benefits for every dollar invested in a high-quality pre-K program,2 and that students from low-income households may benefit the most.3 A growing body of research also shows long-term, non-test score benefits, such as a reduction in disciplinary problems in high school and an increase in college attendance.4 However, some pre-K evaluation studies show limited benefit, if any.5,6 while other studies show that the effects of pre-K fade away over time.7 Most experts agree, however, that if pre-K is provided, quality is integral, as is ensuring that students receive the type of quality education they need to be successful well beyond pre-K.
The more we understand how to increase access to and success in high-quality early childhood education, particularly for historically marginalized communities, the more successful future generations will be academically, socially, and emotionally.
The data
Texas spends half as much per child enrolled in pre-K than the national average
According to the National Institute for Early Education’s 2023 State of Preschool Yearbook, Texas ranks 34th in state spending, and as of 2023, the national average of spending per pre-K student was double what Texas spends. Through the passage of HB3 in 2019, an estimated $835 million in additional state funding was provided for early childhood education programs.
Between 2018–19 and 2020–21, Texas significantly increased pre-K spending, with a nearly 50% rise in 2020–21, marking its largest increase since at least 2003. Yet, Texas’ per-child spending remained 40% lower than the national average. This funding gap has widened since 2020–21, with Texas’ pre-K spending per child decreasing by 35% through 2022–23 (latest available as of May 2025) to $4,235—half the national average.
Texas spent $4,235 per child in 2022–23—54% less than what it spent in 2020–21 and half the national average in 2022–23.
More than 90% of Houston-area pre-K students are enrolled in full-day programs
Is pre-K free in Houston? Texas, like most states, does not offer universal early childhood education. However, children are eligible for free pre-K programs if they are unable to speak and comprehend English, are economically disadvantaged, are experiencing homelessness, or are in foster care. Children from military families are also eligible for free pre-K programs if they have a parent in active military service or who was killed/injured in service or a parent who received the Star of Texas Award.
In Texas, pre-kindergarten operates differently by school district as well. Some districts operate their own pre-K programs, while other districts contract with facilities, such as local child care centers, to provide their pre-K programs.
The number of pre-K programs in the three-county area increased to 617 in 2023–24 from 550 in 2015–16. Since the 2015–16 school year, the number of pre-K programs has continued to increase across the Houston region with the largest increase occurring between the 2019–20 and 2021–22 school years when an additional 35 programs were added. The Houston area has had a net-gain of 67 pre-K programs, an 11% increase since 2015–16.
High-quality pre-K for the full day has added benefits over a shorter-day program, particularly for low-income children. Students from low-income families who attended a full-day pre-K program had higher scores on readiness assessments and better attendance.8
Fort Bend saw the largest gains in full-day pre-K enrollment immediately following the passage of HB3, increasing by 56 percentage points from 19% in 2018–19 to 75% in 2019–20 . Full-day pre-K enrollment has also increased in Harris and Montgomery counties. In the 2023–24 school year, Montgomery County had 100% full-day pre-K enrollment, and Fort Bend County had over 90%, and Harris County had 93%.
Pre-kindergarten enrollment in Fort Bend and Montgomery counties rebound from pandemic losses
Students who attend pre-K can join a public program or a private program. About half of students enrolled in pre-K in Fort Bend, 60% in Harris County, and 57% in Montgomery County attend a public program, according to 2023 American Community Survey data.
A study from the Houston Education Research Consortium (HERC) found that while families considered many factors in deciding whether to enroll their children in pre-K, the distance of the program is among the most influential.
Pre-K enrollment in public schools in the three-county region reached a decade low in 2020–21 when there were 37,606 students enrolled. As of the 2023–24 school year, pre-K enrollment numbers have rebounded in Fort Bend and Montgomery counties but still lag in Harris County and across Texas.
In the past decade between 2013–14 and 2023–24, Fort Bend and Montgomery counties have seen significant growth in pre-K enrollment increasing by 75% and 36%, respectively. Texas has experienced a smaller increase over this period with enrollment numbers increasing by 4%. Harris County experienced a decrease of 15% in pre-K enrollment.
According to the 2023 State of Preschool Yearbook released by the National Institute for Early Education Research, Texas ranks 14th in pre-K access for three-year-olds and 10th in pre-K access for four-year-olds among the 50 states. In the 2022–23 school year, 19% of three-year-olds and 58% of four-year-olds living in the state were enrolled in public pre-K programs. This is above the national rate of 17% of three-year-olds and 46% of four-year-olds.
Fort Bend County began offering pre-K to three-year-olds in 2020–21, enrolling slightly over 80 students that year, while Montgomery County had no three-year-olds in pre-K. In 2023–24, three-year-olds comprised 14% of pre-K enrollment in Harris County, compared to 18% statewide. The lack of programs is a lost opportunity, especially for students with special educational needs, English language learner students, and low-income families. A report on HISD schools by the Kinder Institute’s Houston Education Research Consortium (HERC) found that “students who received two years of pre-K education had a greater likelihood of school readiness than those who only got one.”
One way to measure if early education is reaching the intended population is to compare the number of first-grade students who would have been identified as eligible to attend pre-K with the number of students who actually attended pre-K two school years prior. For example, first graders in 2023–24 would have attended pre–K as four-year-olds in 2021–22.
Using the 2023–24 first-grade student data to determine pre-K eligibility, 68% of eligible four-year-olds in Harris County were enrolled in a public pre-K program in 2021–22. In Montgomery County, 61% of eligible students attended pre-K in 2021–22, and in Fort Bend that number was 36%.
Following the 2019–20 school year, there was a decrease in the rate of first graders (two years later) who were eligible for and attended pre-K during that school year. This rate went down by 15 points in Fort Bend County, 22 points in Harris County, 13 points in Montgomery County, and 21 points across the state. Between 2020–21 and 2021–22 this rate increased for all geographies except Fort Bend County where it fell an additional 10 points.
The Houston three-county region has a higher rate of pre-K English-language learners compared to the state
Because of eligibility requirements, almost all public pre-kindergarten students at Texas public schools are economically disadvantaged. In the 2023–24 school year, 83% of students enrolled in Texas public pre-K programs were classified as economically disadvantaged.
In the 2023–24 school year, 87% of students enrolled in Houston’s three-county area public pre-K programs were classified as economically disadvantaged, on par with the state. Additionally, 51% of the region’s pre-K public school students were English language learners (14 points higher than the state), and 6% were served by special education programs.
Across Texas, the majority (62%) of children enrolled in free pre-K programs are Hispanic. Black and white children are enrolled almost equally at 15% and 14%, respectively, while 5% of students are Asian American and 3% are multiracial.
A similar pattern exists regionally, but with considerable variations across counties, reflecting their respective racial/ethnic compositions. Given the extent to which race/ethnicity correlates with income and that pre-K programs are targeted to reach economically disadvantaged students, in 2023–24 in the three-county area, 61% of students are Hispanic, 22% are Black, 8% are white, 7% are Asian American, and 2% are multiracial. Consistent with the overall demographic composition of the counties, Montgomery County has a significantly higher share of white children enrolled in pre-K (23%), and Fort Bend County sees a much higher percentage of Asian-American students (21%).
Kindergarten enrollment dips in Harris County but climbs in Fort Bend and Montgomery
Just as pre-K has been shown to have benefits to the child, so has kindergarten. Students who attend high-quality kindergarten enjoy a variety of academic and social-emotional boosts. According to established research, “the years from birth to age 5 are viewed as a critical period for developing the foundations for thinking, behaving, and emotional well-being.”9 Furthermore, providing high-quality education prior to students starting the first grade has substantial medium- and long-term benefits. Students are less likely to repeat a grade and are more prepared academically as they get older.10
In Texas, children who are five years old on or before September 1 are eligible, but not required, to attend kindergarten that year. Kindergarten at a Texas public school may be provided for half a day or a full day at the discretion of the district’s school board.
Kindergarten enrollment declined during the pandemic between 2019–20 and 2020–21, falling by 6–7% in each Houston-area county and the state. Although enrollment rebounded in 2021–22, it has since continued to decline in both Harris County and across Texas overall. As of the 2023–24 school year, Harris County has even fewer kindergarteners than it did in 2020–21—continuing a decade-long trend of decline. Over the past 10 years, Harris County has seen a 15% decrease in kindergarten enrollment, with Texas overall down 8% in the same period.
Fort Bend and Montgomery counties have been experiencing the opposite trend where kindergarten enrollment has steadily grown, not only recovering from pandemic-era losses but also surpassing pre-pandemic levels. From 2013–14 to 2023–24, Fort Bend saw a 17% increase and Montgomery experienced a 20% jump. Notably, this upward trend in enrollment aligns with the population growth these counties have experienced during the same period.
As of 2023–24, Harris County has fewer kindergarteners than it did in 2020–21—continuing a decade-long trend of decline.
Kindergarten students in the Houston area come from diverse backgrounds
In the 2023–24 school year, of the 73,295kindergarteners enrolled in Harris, Fort Bend, and Montgomery counties’ public schools, nearly 70% were considered economically disadvantaged, with Harris County’s rate being the highest at 71%. Over one-third of students enrolled in the three-county region were classified as English language learners (ELLs) and 10% were provided with special education services. Fort Bend and Montgomery counties have a lower percentage of students who are economically disadvantaged and who are ELLs compared to Harris County. Between 2019–20 and 2023–24, the percentage of kindergarten students in these categories have increased in each county and the state. The share of economically disadvantaged and ELL kindergartens each increased by about 6 percentage points in Fort Bend and Montgomery counties.
In the 2023–24 school year, the majority of kindergarteners in Texas public schools were Hispanic (53%), followed by white students (25%).
Across the three-county area, 52% of kindergarteners enrolled were Hispanic, 19% were white, and 18% were Black. Fort Bend County had the largest percentage of Asian-American kindergarteners (20%) in 2023–24 school year, while Montgomery County had the largest share of white kindergarteners (41%). Harris County has the highest percentage of Hispanic kindergarteners in the region at 56%.
Some kindergartners enrolled in the Texas public school system are assessed on the Commissioner’s List of Reading Instruments, an inventory of the skills necessary for continued literacy development. Students must pass all required assessment domains to be considered kindergarten-ready. More than half (52%) of Texas students who took the assessment at the beginning of the year met or exceeded the proficiency cut-off score.
Prior to the COVID-19 pandemic, kindergarten readiness assessment rates were historically lowest in Montgomery County (31% in 2019–20) compared to Harris County (90%) and Fort Bend County (96%). However, during the first full school year of the pandemic (2020–21), assessment rates soared by 53 percentage points in Montgomery County as rates declined in Fort Bend and Harris counties, and statewide. Since then, Montgomery County has maintained the highest assessment rates in the region. Fort Bend County’s assessment rates have recovered to pre-pandemic levels, while Texas as a whole has surpassed them. In Harris County, kindergarten readiness assessment rates still haven’t fully recovered.
During the 2020–21 school year, the share of kindergarten students considered kindergarten-ready increased by 25 percentage points in Fort Bend and Harris counties compared to the prior year, likely due in some part to the significant decreases in kindergarten readiness assessment rates. After the pandemic, kinder-readiness rates rebounded to pre-pandemic levels in Fort Bend County (similar to their assessment rates), and as of the 2023–24 school year, kinder-ready rates are still 15 percentage points higher in Harris County than they were during the 2019–20 school year. Kinder-ready rates between the 2017–18 and 2023–24 school years increased by 5 points in Montgomery County, 14 points in Harris County, and 26 points in Fort Bend County.
During 2020–21, the percentage of kindergarten students considered kindergarten-ready increased by 25 percentage points in Fort Bend and Harris counties compared to the prior year.
Burger, Kaspar. “How Does Early Childhood Care and Education Affect Cognitive Development? An International Review of the Effects of Early Interventions for Children from Different Social Backgrounds.” Early Childhood Research Quarterly 25, no. 2 (2010): 140–65. https://doi.org/10.1016/j.ecresq.2009.11.001
Lee, Valerie E., and David T. Burkam. Inequality at the starting gate: Social background differences in achievement as children begin school. Washington, D.C.: Economic Policy Institute, 2002.
Gray-Lobe, Guthrie, Parag A. Pathak, Christopher R. Walters. “The Long-Term Effects of Universal Preschool in Boston” National Bureau of Economic Research Working Paper Series. (2021). https://www.nber.org/papers/w28756
Pages, R., Lukes, D. J., Bailey, D. H., & Duncan, G. J. (2020). Elusive longer-run impacts of head start: Replications within and across cohorts. Educational Evaluation and Policy Analysis, 42(4), 471-492.
Lipsey, M. W., Farran, D. C., & Hofer, K. G. (2015). A Randomized Control Trial of a Statewide Voluntary Prekindergarten Program on Children’s Skills and Behaviors through Third Grade. Research Report. Nashville, TN: Vanderbilt University, Peabody Research Institute.
Reynolds, A. J., Richardson, B. A., Hayakawa, M., Lease, E. M., Warner-Richter, M., Englund, M. M., Ou, S. R., & Sullivan, M. (2014). Association of a full-day vs part-day preschool intervention with school readiness, attendance, and parent involvement. JAMA, 312(20), 2126–2134. https://doi.org/10.1001/jama.2014.15376
Linda Bakken, Nola Brown & Barry Downing (2017) Early Childhood Education:The Long-Term Benefits, Journal of Research in Childhood Education, 31:2, 255-269, DOI: 10.1080/02568543.2016.1273285
McCoy, D. C., Yoshikawa, H., Ziol-Guest, K. M., Duncan, G. J., Schindler, H. S., Magnuson, K., … & Shonkoff, J. P. (2017). Impacts of early childhood education on medium-and long-term educational outcomes. Educational Researcher, 46(8), 474-487.
One of the strongest forces to shape the region, Houston’s diverse population is also its greatest asset.
In the last decade, the population in Houston’s three-county region — due to strong levels of international and domestic migration — grew substantially and became far more diverse.
Why population and diversity matter to Houston
One of the Houston area’s greatest assets is its diversity. As one of the most diverse regions in the nation, Houston’s three-county area connects people with a broad range of perspectives, lived experiences, and ways of life to create a metropolis with a vibrant culture and dynamic economy. The region’s recent population boom — driven by domestic and international migration — continues the decades-long trend of attracting people seeking opportunity and success from across the globe.
By leaning into our greatest strength — our people — we can build a more vibrant Houston region with opportunity for all.
The data
Nearly 6.5 million people call the Houston-area home
Harris County covers 1,777 square miles in the region, followed by Montgomery County with 1,077 square miles coverage, and Fort Bend County with 885 square miles. Together, the three counties cover 40% of the nine-county Houston-Sugar Land-The Woodlands Metropolitan Statistical Area (MSA).1
How many Houstonians are there, and where do they live? Houston’s three-county region has a total population of nearly 6.5 million that accounts for 86% of the Houston MSA population.
The population in Houston’s three-county region has grown 142% since 1980 from 2.7 million to 6.5 million in 2023.
Each county has witnessed remarkable population surges over the past few decades. In Fort Bend County, the population doubled over the last two decades, reaching nearly 920,000 in 2023. Montgomery County’s population also doubled, soaring from 294,000 in 2000 to 710,000 in 2023. In Harris County, the most populous county in the region and the state, the population climbed above 4.8 million.
This recent population growth is a part of a robust historical trend. Since 1980, Greater Houston’s population growth has consistently outpaced national and statewide trends. Fort Bend and Montgomery counties, in particular, have emerged as leaders, regularly recording growth rates that are double or even triple those observed in Harris County and Texas. The implications of this sustained population growth are profound, shaping Houston into a national power player and propelling economic growth in the region.
In the most recent decade, 2013 to 2023, population growth rates have stayed the same in our region and continues to outpace national growth. During this decade, population increased by 41% in Fort Bend County, 12% in Harris County, and 43% in Montgomery County compared to a 15% growth across the state and 6% across the nation.
159%
Fort Bend County experienced the greatest population growth in the Houston region between 2000 and 2023.
Houston’s racial/ethnic composition continues to be diverse
Since 2000, the racial composition of Greater Houston’s population has changed significantly. The number of Hispanic and Asian-American residents has boomed, propelling the region into one of the most ethnically diverse in the country.
In each of Houston’s three counties, the number of residents that identify as people of color (non-white) grew faster than the population of white residents. This has driven the profound demographic change that the Houston area has undergone over the last few decades.
In 2023, Asian American (22.2%), Black (21.2%), and Hispanic (24.8%) residents comprised two-thirds of Fort Bend County’s population. White people, comprising less than one-third of the county’s total population, grew steadily, but slower compared to other racial/ethnic groups. While Fort Bend County’s Hispanic and Black population grew by over 50%, the Asian-American population doubled in size between 2010 and 2023.
Harris County has been majority-people-of-color since 2000, and recent data show that people of color continue to propel the county’s growth. Hispanics have been the largest ethnic group since 2010, and by 2023 they comprised 44.1% of the total population. Since 2010, the county has seen the most growth in the Asian American (42.5%) population, with more modest growths in its Black (21.6%) and Hispanic (27.5%) populations. Notably, Harris County is the only county in Greater Houston where the number of white residents declined between 2010 and 2023.
With 710,000 residents in 2023, Montgomery County’s population has doubled over the last two decades. While the county remains mostly white (57.8%) — with its Hispanic (28.3%), Black (7.0%) and Asian American (3.2%) populations making up nearly two-fifths of the county’s total population in 2023 — Montgomery County has experienced incredible growth in Asian-American (145.4%), Hispanic (112.3%) and Black (170.0%) populations between 2010 and 2023.
The percentage of the population that identifies as Hispanic/Latino in Harris County has increased to 44.1% in 2023 from 32.9% in 2000.
In Houston’s three-county area at large, the vast majority (80%) of children under five are people of color, indicating that Greater Houston will continue to become more racially diverse over time. Fort Bend County shows a somewhat-even distribution of races/ethnicities in this age group. A vast majority of Harris County’s youngest population are people of color (82%). In contrast, nearly half of children under five in Montgomery County are white (47%), a similar proportion to the country overall, and over a third are Hispanic.
Houston’s three-county region population soars 142% over four decades
Analyzing population distribution by age group provides a clearer picture of population change by revealing which age groups are driving growth and informing how resources should be allocated to address emerging needs.
While Houston’s population boomed during the 2010s, the growth between 2013–2023 was uneven among age groups. Notably, older adults (65 and older) saw the greatest percentage increase in Fort Bend, Harris, and Montgomery counties. The growth among older adults in Fort Bend was especially pronounced, soaring 105%.
While older adult populations had the largest growth, there were age-specific disparities within racial groups. In Fort Bend County, the number of children of color under five increased by 30%, while the number of non-Hispanic white children in the same age group decreased. In Harris County, the number of children under 5 decreased overall while children ages 5 to 17 and adults ages 18 to 64 who are non-Hispanic white decreased and those who are people of color increased. This trend is very similar to what occurred across Texas during the same time frame and matches trends in population growth by age at the national level. Montgomery County’s overall, non-Hispanic white, and people of color populations increased across all age groups with people of color increasing the most within each age group.
The number of older adults (65+) who are people of color in Montgomery County tripled between 2013 and 2023.
Population in Greater Houston could double to 12 million by 2050
Analyzing population growth by age group provides insights into the region’s demographic future. Population projections are used to make decisions about how to prepare for future demand and needs for resources like food, water, energy, housing, and services. By analyzing how Houston’s population grew the last few decades, we better understand what the impacts of that growth will be.
The following are demographic forecasts for Houston’s three major counties. By 2050,
Fort Bend County is projected to reach over 2 million people with a demographic breakdown of 40% Asian, 24.9% Hispanic, 22.2% white, and 12.9% Black.
Harris County is projected to reach almost 8 million people with demographic breakdown of 42.4% Hispanic, 20.8% white, 19.5% Asian/Other, and 17.6% Black.
Montgomery County is projected to reach 1.5 million people with a demographic breakdown of 41% white, 40% Hispanic, 13.3% Asian/Other, and 7.7% Black.
Immigration in Houston drives population growth
What is driving Houston’s population growth? Generally, the primary drivers of population growth are the result of three factors: levels of fertility, mortality, and migration. Simply put, our population would grow as long as the number of births exceeds the number of deaths — this is known as the natural population increase. Migration, on the other hand, measures the movement of people from one area to another, and net migration measures the difference between the number of people who move into and out-of an area. Migration can be domestic, referring to the migration of people within the United States, or international, which refers to the movement of people across national borders.
From 2010 to 2023, population growth in Fort Bend and Montgomery counties was largely driven by domestic migration. In Fort Bend, natural changes in population accounted for an additional 75,000 people, while 203,000 people moved into the county from elsewhere in the United States. In Montgomery County, natural changes in population resulted in an additional 44,300 residents, while 193,100 people moved to the county from elsewhere in the United States.
The story is different in Harris County. Overall, net migration was positive from 2010-2016 but became negative almost entirely due to the drop in domestic migration. In fact, net migration was consistently negative in Harris County between 2017 and 2021 rebounding once again in 2022 solely because of international migration as net domestic migration has been negative in Harris County since 2016. From 2010 to 2023, natural changes in population resulted in an additional 532,900 Houstonians, while 378,000 people moved into the county from outside of the United States.
Immigrants comprise a larger share of the Houston area than the nation overall
The Houston area owes much of its economic success and cultural vibrancy to the immigrants who have made this region their home. While categorized under one label, the “immigrant population” comprises people who were born outside the United States (foreign born), including naturalized citizens, legal permanent residents, temporary residents, and unauthorized immigrants.
More than one in four individuals living in the Houston three-county region are immigrants. Among the three counties, Fort Bend County is home to the highest share of immigrants (31%) with Montgomery County home to the lowest (17%). For the past few decades, Houston’s immigrant community has grown at a faster rate than the U.S.-born population, and this trend is showing no sign of slowing in Fort Bend.
The number of new Americans rebound to pre-pandemic numbers
What are naturalized citizens? When a foreign-born resident becomes naturalized, they become a legal citizen of the United States and now have the same constitutional rights and civic responsibilities as a native-born citizen, including eligibility to vote. To become a naturalized citizen, immigrants must meet certain requirements, including completing a five-year period of lawful permanent residence, demonstrating basic proficiency in English, U.S. history, and civics, and passing a background check. Naturalized citizens tend to have higher incomes and rates of homeownership compared to non-citizens.22
The number of residents achieving lawful permanent resident status in Texas and the Houston MSA has declined sharply after peaking in The number of residents achieving lawful permanent resident status in Texas and the nine-county Houston Metro Area has rebounded after a sharp decline in 2020. The same is true for the number of residents becoming naturalized citizens with current numbers surpassing what we have seen in the last two decades. These trends mirror national trends where in 2022 the number of U.S. residents becoming naturalized citizens was the third highest on record.
Most unauthorized immigrants in the Houston-area have lived in the country for five or more years
How many unauthorized immigrants are in the U.S.? About 11 million unauthorized immigrants reside in the nation, representing about 24% of the total immigrant population in the U.S. About 16% of the nation’s unauthorized immigrant population — around 1.7 million — live in Texas.
How many unauthorized immigrants are in Houston? The Migration Policy Institute estimated in 2021 (most recent available as of publication) that 481,000 unauthorized immigrants live in Harris County, 39,000 in Fort Bend County, and 28,000 in the area of Montgomery, Chambers, and Liberty counties. Harris County is home to the second largest unauthorized immigrant community in the nation — Los Angeles County leads the nation with 951,000 unauthorized immigrants.
Most unauthorized immigrants in the U.S. and Texas have lived in the country for five or more years. The share of undocumented immigrants by years of residence is about evenly distributed across Houston’s three-county area. Fort Bend County has the highest proportion of undocumented immigrants who entered the country in the last five years (30%), while Montgomery County has the highest proportion of unauthorized immigrants who have lived in the U.S. for 20 or more years (25%). Harris County, meanwhile, has the highest proportion of unauthorized immigrants who have lived in the county for 10-14 years (19%).
The distribution of the unauthorized community by age is fairly consistent across the U.S., Texas, and Houston’s three-county area. Most unauthorized residents — 55% — range from 25 to 44 years old. The smallest groups of unauthorized immigrants are under the age of 16 and over the age of 55.
Where are most unauthorized immigrants in Houston from? People from Mexico and Central America are the majority of unauthorized immigrants in Houston’s three-county region. In Fort Bend County, 35% of unauthorized immigrants come from Asia (compared to 15% nationally), and in Montgomery County 85% of unauthorized immigrants hail from Mexico or Central America.
More than 140 languages are spoken in the Houston area
One of the main ways in which diversity in Houston manifests itself is in the number of languages spoken in the region. Houstonians are multi-linguistic: English, Spanish, Vietnamese, Chinese, and Hindi are all spoken at high rates.
Other than English, the most commonly spoken language across Houston’s three-county region is Spanish. Following Spanish, the most commonly spoken languages are Vietnamese, Chinese, and other Indo-European languages, such as French, German, Gujarati, Hindi, Italian, Russian, Urdu, etc. Fort Bend County has the greatest linguistic diversity of Houston’s three counties.
The Houston region is diverse, but is it integrated?
While the Houston area is remarkably diverse, this diversity alone does not necessarily guarantee meaningful interaction between residents of different backgrounds. Historically, the United States’ major cities — including Houston — were highly segregated. Residents of different racial and ethnic backgrounds can not interact and connect with each other if they are forcefully separated by exclusionary zoning codes, interstate highways, and social stigma. While explicit segregation is illegal, we continue to see its impact in the make-up of our modern neighborhoods.
The fractionalization index uses population data to measure the likelihood that two random people in a given area will be of a different race or ethnicity. Scores range from 0 to 1, with 0 indicating that two randomly chosen people belong to the same ethnic group, and one indicating maximum diversity (a 100% chance that two randomly chosen people are of different racial/ethnic backgrounds).
In 2023, Fort Bend County had the highest level of racial/ethnic mixture in Houston’s three major counties, scoring a 0.76 in the fractionalization index. Harris County scored a 0.7, while Montgomery County scored a 0.58, reflecting a lower probability that two randomly selected individuals in the areas will belong to different racial or ethnic groups. Neighborhoods in both Fort Bend and Harris counties exhibit more racial and ethnic plurality than the average American and Texan neighborhood (0.62 and 0.67, respectively).
Fort Bend, Harris, and Montgomery counties scored higher on the fractionalization index in 2023 than in 2010, indicating these places grew more diverse in the last decade. Fort Bend County’s score increased from 0.74 to 0.76; Harris County’s from 0.69 to 0.70; and Montgomery County saw the greatest increase, jumping from 0.45 to 0.58 in the fractionalization index.
Nearly 210,000 veterans live in Houston’s three-county region
A veteran is a person who served in the active military, naval, or air service, and who was discharged or released under conditions other than dishonorable. As of 2023, there are nearly 16 million veterans in the United States. Texas is home to the largest number of veterans with 1.4 million in the state.
Nearly 210,000 veterans live in Houston’s three-county region, with the greatest concentration of vets in Montgomery County (6.6%). About 4% of the population in Fort Bend and Harris counties are vets.
Compared to non-veterans, veterans are about twice as likely to have a disability, and they are half as likely to live below the poverty threshold.
The nine-county Houston-Sugar Land-The Woodlands Metropolitan Statistical Area (MSA) includes Austin, Brazoria, Chambers, Fort Bend, Galveston, Harris, Liberty, Montgomery, and Walker counties.
Voter registration and turnout levels in the region have risen while non-electoral participation lags
The 2020 election inspired the biggest increase in voter registration and turnout in the region’s recent history, but Houston has more work to do on other measures of civic engagement.
Why voter and non-electoral participation matters to civic engagement in Houston
Of the various ways in which citizens can engage in a civil society, the act of selecting our representation at the local, state and federal levels is one of the most obvious and basic. Research has shown that Americans are more likely to vote if they know and understand the process, if the rules and regulations are easy to navigate, and if they believe their vote “matters.” In October 2020, the Cost of Voting Index found that Texas makes the process of registering to vote, finding where to vote and casting a ballot the most challenging among all states in the nation by having a restrictive voter registration process, fewer polling sites, and voter ID laws. Contacting officials once they have been elected is also an important indicator of civic engagement as it requires citizens to remain up to date on issues and to voice opinions and preferences on public policy.
By coming together with an informed perspective on civic participation in our region, we can do more not only to address barriers to higher voter turnout but also continued engagement between elections; thereby, increasing civic engagement in Houston communities and accountability in the political process.
The data
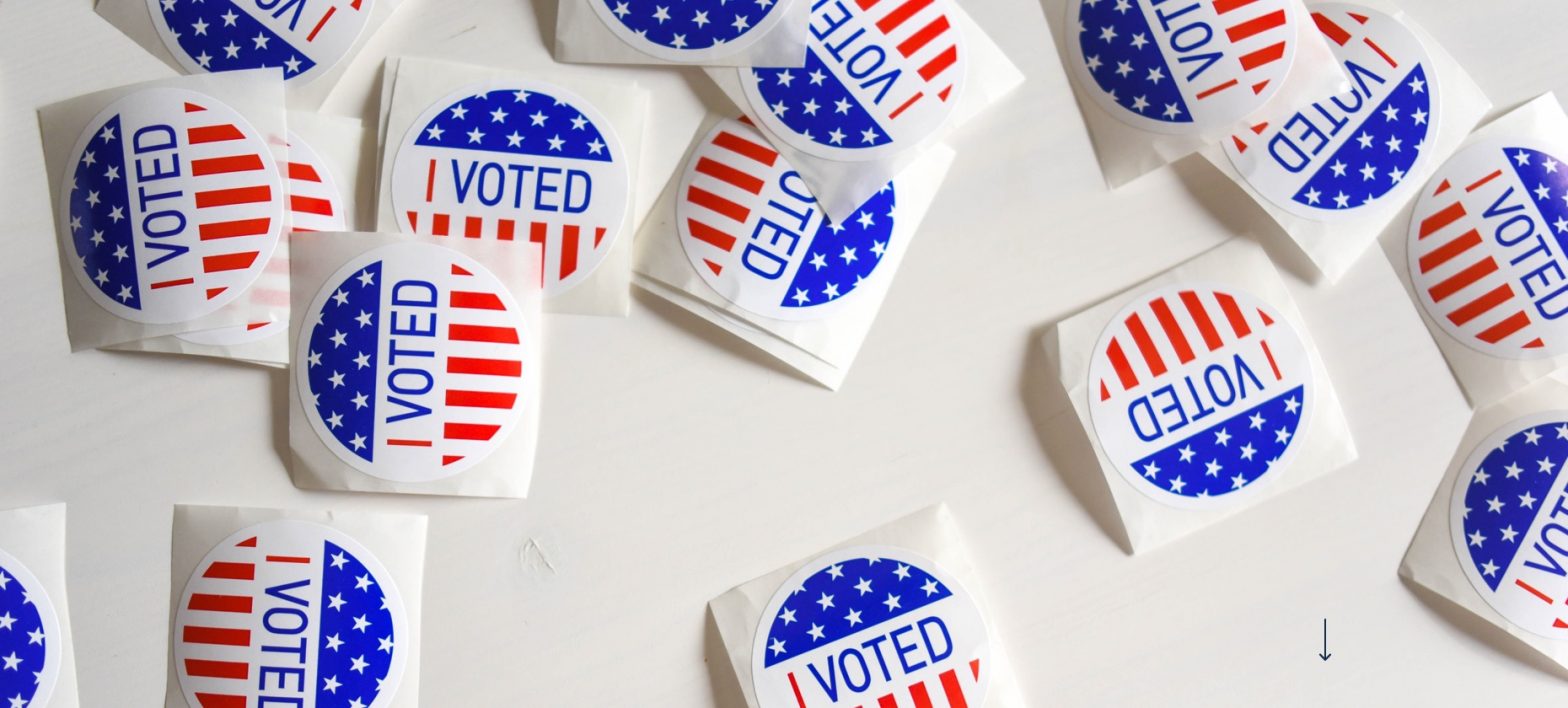
Houston’s voter registration rate continues to grow
In the United States, citizens 18 and older can vote in an election. The U.S. Constitution grants the states the responsibility of overseeing federal and local elections. This means the way in which elections are administered differs from state to state. For example, in all but one state a person must register to vote before they are allowed to participate in an election. In Texas, voting requires registration at least 30 days prior to an upcoming election. The applicant must submit an application to the county registrar and meet several requirements in order to become a registered voter.
The total number of registered voters in the three-county area has grown steadily over the past 12 years in parallel with the growth in the overall population. Since the 2008 presidential election, Harris County has gained over half a million registered voters. Since 2008, Fort Bend and Montgomery counties have increased their number of registered voters by 61% and 52%, respectively, compared to 27% for Harris County.
Texas saw its number of registered voters decline immediately after the 2008 presidential election, but the number of registered voters has steadily increased since 2010. As of 2020, Texas now has nearly 17 million registered voters. At the national level, the change in registered voters has fluctuated over the past 12 years. However, it reached a new high of 168 million registered voters in 2020.
Registering to vote is the first step to voting in Houston and national elections. All three counties have higher shares of eligible voters who are registered voters than both the state and the nation. Despite this strength, there is still a large number of people who are eligible to vote but who are not yet registered.
In Fort Bend, 95% of the eligible population is registered to vote, as is 93% in Montgomery. Combined, this represents approximately 50,000 people who could be registered. The Harris County voter registration rate is 88%, reflecting about 320,000 eligible voters who are not yet registered. Harris County’s voter registration rate fell from 88% in 2008 to 82% in 2014 and did not fully rebound to its 2008 level until the 2020 presidential election.
Research shows that voter registration rates vary by demographic characteristics. For example, educational attainment plays a role in the likelihood of registering to vote. In the nine-county Houston metropolitan area in 2020, citizens of voting age with lower levels of education were less likely to be registered voters than their more educated counterparts. The registration rate for residents with at least a bachelor’s degree was 25 percentage points higher than those with a high school diploma only.
In 2020, Black citizens had the highest voter registration rate among selected racial/ethnic groups (82%). Additionally, Hispanic citizens were 13 and 22 percentage points less likely to be registered to vote than white or Black residents, respectively. Between 2016 and 2020, Black voters made the most gains in registration (11-point increase), while Hispanic registered voters increased 7 percentage points. Between 2016 and 2020, the share of citizens who registered to vote increased for all groups including Hispanics but estimates indicate their voter registration rates remain the lowest of the three racial/ethnic groups in this data set.
Hispanic citizens were 13 and 22 percentage points less likely to be registered to vote than white or Black residents, respectively.
While not represented in the data set above, nationally, Asian Americans increased their turnout rate by more than any other racial or ethnic group between the 2016 and 2020 presidential elections, with 59% of Asian-American citizens of voting age voting. Voting rates vary depending on Asian-American ethnic group with Indians (71%), Japanese (66%), and Koreans (60%) voting at the highest rates (and much higher compared to 2016). Furthermore, naturalized citizens were more likely to register to vote than native-born citizens.
2020 election turnout sets records, still lags behind U.S. participation rates
Voting in the U.S. is not mandatory and is considered both a right and a privilege. Depending on eligibility criteria, which states determine, voting can be done in-person or by-mail and conducted early or on election day. As Houston’s population grows we expect to see more voters in our region, and voter turnout in presidential elections typically exceeds that in midterm elections. Nearly 2.3 million people in our region cast a ballot In the 2020 Presidential Election. About 72% were cast in Harris County (1.6 million), 16% in Fort Bend (357,000) and 12% in Montgomery County (271,000).
Voter turnout rates can be measured in two ways: by the number of people who cast a ballot among those who registered to vote; and the number of people who cast a ballot among those who are of voting-age U.S. citizens. The former indicator tells us the level of participation among those who are eligible, whereas the latter tells us something about the levels of interest in the political process in a region overall.
The 2020 presidential election inspired the highest levels of voter participation in each of the three counties, as well as in Texas and the U.S., despite occurring during the COVID-19 pandemic. Voter turnout increased almost 10 percentage points in Fort Bend between 2016 and 2020, compared to a 7.8-point increase in both Harris and Montgomery counties. This high voter turnout continues the trend that started with the 2018 midterm election, in which voter turnout rose more than 20 percentage points in all three counties compared to 2014. However, our region’s presidential and midterm turnout rates continue to lag considerably compared to those of the U.S. overall.
The region and state’s lag in voter turnout does improve when comparing the citizen voting age population turnout instead of the registered voter population turnout. For example, 71% of Fort Bend’s citizen voting age population voted in the 2020 election. Montgomery saw 68% of its voting age population cast votes in 2020 as well. These turnout rates are higher than the U.S. rate of 67%. In Harris County, 59% of those eligible to vote in the 2020 election did so. In other words, over 40% of Harris County’s eligible voters didn’t participate in the most recent election. Even in Fort Bend and Montgomery counties, one in four eligible voters sat out the 2020 election. Although Houston’s voter registration rate is higher than the national average, the turnout rate still lags.
While there are many ideas on how to improve turnout for Texas voting, including same-day voter registration and automatic registration for 18-year-olds, some political analysts believe the lack of competitive races at the higher levels of government dissuade potential voters in Texas from exercising their right to vote. Encouraging more people to run is an important aspect of the electoral system that can lead to an increase in voter participation.1
In addition, given the racial/ethnic diversity of our region, targeted voter registration and voter turnout efforts among the Hispanic/Latino population and less educated populations are necessary to increase voter participation in the region overall. Research has shown campaign or “get out the vote” outreach efforts can promote voter turnout. Nationally, while most eligible voters reported that they received a campaign contact before the 2020 election, lower shares of Hispanic/Latino and Asian-American voters reported being contacted across various methods (e.g., mail, flyers, text message, email, phone call, home visit).
Early voting in Houston is an increasingly popular choice
One aspect of the states’ responsibility in overseeing elections is to decide if, when, and how to allow voting opportunities prior to Election Day. Research indicates early voting is an effective approach to increasing voter turnout — particularly among women and those of working age — by allowing increased time and flexibility to cast a vote.2
Early voting in Texas takes place in one of two ways: by showing up in person during the prescribed early-voting period or by voting by mail. Early voting has been a consistently popular choice with voters in the three-county area. In fact, for every November election in the past 12 years, more than 50% of the total votes were cast during the early-voting period. The 2020 election saw an even greater increase in early voting, with more than 88% of the votes in the three-county region being cast before Election Day, likely because of the pandemic and a desire to avoid crowds.
For every November election in the past 12 years, more than 50% of the total votes were cast during the early-voting period.
Access to early voting in Texas varies by method. Any registered voter may vote in person at early voting locations, but to vote early by mail, the registered voter must complete an application for the ballot by mail (previously referred to as “absentee voting”) if eligibility criteria are met. In Texas, voting in the 2020 election was most likely to happen in-person — 90% of early ballots were cast at early voting locations — rather than by mail. Fort Bend and Montgomery follow a similar pattern, with 91% and 90%, respectively. In Harris, in-person early voting was slightly lower at 88%.
It is not possible to compare early-voting methods across the U.S. as there are significant differences in election laws. For example, five states conduct all elections entirely by mail: Colorado, Hawaii, Oregon, Washington and Utah.
Contacting public officials is a rare occurrence in Greater Houston
The ability to contact elected officials to discuss our concerns is one of the trademark features of American democracy. However, few in our region take advantage of this right.
In 2019, 6.5% of the population in Houston (MSA) contacted a public official at least once a year. This is similar to the state rate but lower than the national rate of almost 9%. When people don’t reach out to their elected officials, not only do they lose the chance to advocate for their position, the elected official loses the ability to understand how a policy will directly affect their constituents.
Census participation is an important component of civic health
Another constitutionally designated civic activity is participation in the decennial census. Article I, Section 2, Clause 3 of the U.S. Constitution mandates a count of every person living in the United States. The importance of an accurate count cannot be overstated. Not only does it determine how many seats a state has in the House of Representatives, it is also used to distribute hundreds of billions of dollars in federal funds. In 2016, Texas received an estimated $44 billion from the 10 largest census-guided programs. An undercount can affect the distribution of federal money for the next 10 years. For example, according to a study by the George Washington Institute of Public Policy, a 1% undercount in Texas’s 2010 population would have cost the state almost $300 million in tax-payer dollars returned to Texas in 2015.3
Being proactive in responding to the census count ensures states continue to receive the correct amount of federal dollars for health clinics (and other similar entities within the healthcare industry), funding for school lunch programs, recovery initiatives for natural disasters in Houston and other critical programs. Households that don’t return their census forms are counted by census workers walking neighborhoods and visiting households, which increases the chance of not being counted. In fact, CUNY’s Center for Urban Research has found that low self-response rates correlate to lower census quality where people are not counted.4
While most states set up a statewide commission to help ensure an accurate count, Texas was one of three states that did not support this initiative. Given the lack of coordination at the state level, local governments tried to fill this role. Fort Bend created a Complete Count Committee, while Harris County and the City of Houston teamed up to create their own Complete Count Committee with a website, outreach program, and toolkit.
With those efforts, over 75% of households in Fort Bend County self-responded to the 2020 Census online, by phone, or by mail. This was a three-point increase from the 2010 Census and is above both the state and national rates. Montgomery County’s self-response rate was 67% for both the 2010 and 2020 census. Despite the outreach efforts, Harris County’s rate fell by two points from 65% in 2010 to 63% in 2020.
Despite national trends, levels of trust in our community and local government are on the rise
Social connectedness and trust — foundational to a well-functioning society — are on the rise in our region, though loneliness levels remain high.
Why social connectedness matters to civic engagement in Houston
Social connectedness is the feeling of belonging — not only in the quality and quantity of our personal relationships, but also in our professional ones, our broader social network, our neighborhood, our community, and beyond (e.g., I’m from the Fifth Ward, I’m a Houstonian, I’m a Texan, I’m an American, I am a citizen of the world). It’s about having an identity, social support system, and community — however that is defined — by the number of close friends we have, our familial relationships, our race or ethnicity, religion, gender identity, profession, alma mater, or even favorite sports team. It’s the sense of belonging and well-being we feel when we are members of a community, we trust society in general and our government, and we have people we can turn to for help.
Why is social connectedness important? People with high levels of social connectedness have strong social support networks;1, 2 have better physical and mental health;3 are less likely to be derailed by negative or stressful events like job loss,4 death,5 or impacts from disasters;6, 7 and are less likely to die prematurely.8, 9 Social connectedness builds social trust — the feeling when you have faith that most people can be trusted — and is correlated with higher volunteer rates and charitable giving levels.10 At the society and economic level, macroeconomists have shown that as trust improves, economic prosperity grows.11 Ideally, we would all have high levels of trust for others in our community and in our government, but the degree to which we feel socially connected and trustful is affected by historical and present circumstances. Historically marginalized groups that have faced discrimination and systemic barriers tend to have lower feelings of connectedness and trust.12, 13 This makes fostering collaboration and effecting positive change all the more difficult.
The more we understand the strengths and links among social networks across the three-county area, the more we can do to bridge gaps and foster the connections necessary to improve our region’s collective well-being and level of civic engagement.
The data
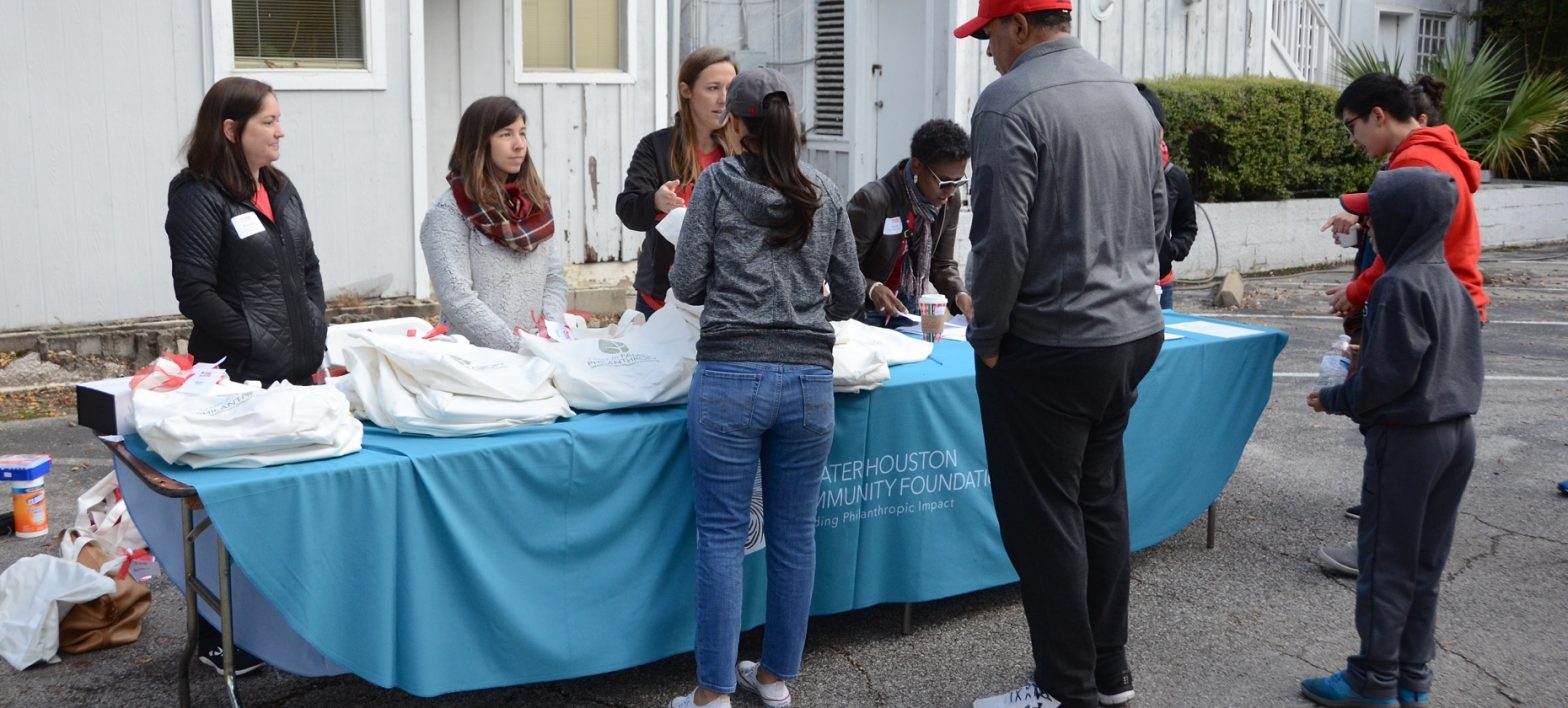
Access to civic and social organizations in Houston increases
Membership in civic and social organizations (non-profit organizations, charities, advocacy groups, meetup groups, social support groups, etc.) in our region is one of the best measures of social connectedness.14 Social connectivity is enhanced when people belong to volunteer groups or civic clubs and organizations because people who belong to such groups tend to trust others who belong to the same group.15
There are fewer organizations relative to the population in Houston’s three-county region than in Texas and the U.S. overall despite access steadily increasing in our region and declining at the state and national level. Across the three-county area, there are 3.2 civic and social organizations for every 100,000 residents, a figure that lags the state (5.2 per 100,000 residents) and nation (7.8 per 100,000 residents).
Historically, Harris County has had the highest rate of civic and social organizations per 100,000 residents than Fort Bend and Montgomery counties, but in 2019, the rate in Montgomery County grew significantly and is now on par with Harris County. Fort Bend has the lowest rate with 2.0 civil-society organizations per 100,000 residents.
Access to these organizations is critical, but whether we participate in them is a different measure of social connectedness.
According to data from the 2018 Houston Civic Health Index, about 35% of residents in Greater Houston say they participated in an organized group between 2013 and 2016. This is about two percentage points lower than the national average, though Greater Houston ranked 24th out of 50 large metro areas in the U.S.
Residents participated in religious organizations at a rate of 18.4%. This was followed closely by neighborhood and community groups. Greater Houston residents are comparatively more active in religious institutions and sports organizations compared to other large metros at 15th and 14th out of 50, respectively, but in each case, participation rates are less than one percentage point off from the national average.
Greater Houston residents are comparatively more active in religious institutions and sports organizations compared to other large metros at 15th and 14th out of 50, respectively
Feelings of loneliness affect more than half of Houstonians
Social connection’s benefits are far reaching. The diversity, quality, and depth of our various social connections can protect us from feelings of isolation and loneliness. Our risk for loneliness is increased by lack of participation in social groups, among other behaviors.16 Loneliness is linked not only to mental health issues like depression and anxiety, but also physical health impacts.17 People with high rates of loneliness are more likely to experience heart disease and stroke,18 compromised immune systems,19, 20 and even premature death.21
Levels of loneliness are difficult to measure, but the industry-standard is the UCLA Loneliness Scale which uses a series of statements to calculate a loneliness score based on responses.22 As part of a national study, Cigna created a Loneliness Index based on a survey of this assessment.23 The index stipulates that the higher the score, the lonelier people are. Possible loneliness scores range from 20 to 80.
According to the Cigna Loneliness Index, the average loneliness score for the nine-county Houston Metropolitan Statistical Area (MSA) ticked up slightly between 2018 and 2019, suggesting that Houstonians have not become significantly lonelier. Loneliness scores in Houston have been slightly higher than in the nation overall.
According to the Cigna Loneliness Index and Survey, about 53% of Houstonians sometimes or always felt lonely in 2019 — about five percentage points higher than in 2018; and the share who felt they have people to talk to and are part of a group of friends declined about eight percentage points to 72% and 65%, respectively.
Nationally, the study found that younger generations are lonelier than older generations, individuals from low-income households are lonelier than their higher-income counterparts, and those living in rural areas are lonelier than those in urban and suburban communities.
The share of adults in Houston who felt they have people to talk to and are part of a group of friends declined about eight percentage points to 72% and 65%, respectively
Growing levels of trust in Harris County
Social trust is generally about having faith that most people in society play by the rules, the rules are fair and the same for everyone, and everyone has a fair shot to pursue the life they want. Established research has found that corruption,24 segregation,25 and economic inequality26 are the factors most closely linked to distrust, meaning as levels of corruption, segregation, and inequality fall, social trust will increase. More recently, research is emerging that suggests social trust is increasingly influenced by the degree of political polarization within a community.27
Countries that have high levels of social and government trust tend to have stronger democracies,28 richer economies,29 and better health.30 Neighborhoods that have high levels of social trust are more likely to work together on important projects to improve their community.31 However, the percentage of residents in the greater Houston area who report working with their neighbors to improve something in the neighborhood in 2018 (latest available) was 2.5 percentage points below the national average.32
Countries that have high levels of social and government trust tend to have stronger democracies, richer economies, and better health.
The 2020 Kinder Houston Area Survey (KHAS) asked residents of Harris County whether most people can be trusted or whether you can’t be too careful with people, and 46% believe they can trust most of their neighbors.
While 2020 data for Fort Bend and Montgomery counties aren’t available, historical data shows that levels of trust were on the rise after a dip in 2015. Between 2015 and 2018, residents’ level of trust has increased from 32% to 43% across the three-county area. Levels of trust in the U.S. overall appear to be higher than levels in our region. The Pew Research Center reported that 52% of Americans in 2018 believe that most people can be trusted — nine percentage points higher than in the Houston area. Levels of trust in 2018 were highest in Fort Bend County, which is also among the most racially/ethnically diverse in the nation.
Levels of trust differ by demographic characteristics. Asian American and white respondents who live in Harris County reported the highest levels of trust in the 2020 KHAS, whereas Black and Hispanic residents reported the lowest trust levels. Disparities in levels of trust by race/ethnicity — also evident in the 2018 survey and consistent with national trends — signal that more can be done to facilitate connectedness within and among our diverse communities. The low levels of trust by Black and Hispanic residents may be explained by historic and contemporary discrimination suffered by those groups.33 Black and Hispanic residents in Houston’s three-county region are more likely to live in low-income communities that tend to be less trusting as these neighborhoods have historically been marginalized and received limited public investment for community and economic development.34
Just over half of residents trust their local government
Social capital has been shown to influence the extent to which residents trust their government.35 When residents trust their governments to do the right thing and work in the best interest of our communities, they are more likely to comply with rules and policies, particularly during natural disasters or times of crisis.36
When asked whether their local government can be trusted to do what’s best for the community, Harris County residents responded mostly positively (56%) in 2019, a marginal increase since 2014. At the national level, public trust in the federal government remains low with only 17% of Americans who said they trust the government in Washington in 2019 to do what is right (in 2020, that rate jumped to 24%).
Historical data on the three-county region shows that the majority of residents in Harris and Fort Bend counties believed in 2014 that local government can be trusted to do what’s best. Montgomery County reported less trust with only 48.8% of residents responding they believe in local government to do what is best for the community.
Jose, P. E., Ryan, N., & Pryor, J. (2012). Does social connectedness promote a greater sense of well‐being in adolescence over time?. Journal of research on adolescence, 22(2), 235-251.
Rowe, J. W., & Kahn, R. L. (1997). Successful aging. The gerontologist, 37(4), 433-440.
Gush, K., Scott, J., & Laurie, H. (2015). Job loss and social capital: The role of family, friends and wider support networks (No. 2015-07). ISER Working Paper Series.
Norris, F. H., & Murrell, S. A. (1990). Social support, life events, and stress as modifiers of adjustment to bereavement by older adults. Psychology and aging, 5(3), 429.
Kaniasty, K. Z. (1991). Social support as a mediator of stress following natural disaster: A test of a social support deterioration model using measures of kin support, nonkin support, and social embeddedness (Doctoral dissertation, University of Louisville).
Nitschke, J. P., Forbes, P. A., Ali, N., Cutler, J., Apps, M. A., Lockwood, P. L., & Lamm, C. (2021). Resilience during uncertainty? Greater social connectedness during COVID‐19 lockdown is associated with reduced distress and fatigue. British Journal of Health Psychology, 26(2), 553-569.
Seeman, T. E., Kaplan, G. A., Knudsen, L., Cohen, R., & Guralnik, J. (1987). Social network ties and mortality among tile elderly in the Alameda County Study. American journal of epidemiology, 126(4), 714-723.
Berkman, L. F., & Syme, S. L. (1979). Social networks, host resistance, and mortality: a nine-year follow-up study of Alameda County residents. American Journal of Epidemiology, 109(2), 186-204.
Wang, L., & Graddy, E. (2008). Social capital, volunteering, and charitable giving. Voluntas: International Journal of Voluntary and Nonprofit Organizations, 19(1), 23.
Conal Smith, “Trust and total factor productivity: What do we know about effect size and causal pathways? ,” Victoria University of Wellington, 2020.
Putnam RD. Bowling alone: the collapse and revival of American community. New York: Simon and Schuster; 2001
Rupasingha, Anil, Stephan J. Goetz, and David Freshwater. “The Production of Social Capital in US Counties.” The Journal of Socio-Economics 35, no. 1 (2006): 83-101.
Julianne Holt-Lunstad, PhD, The Potential Public Health Relevance of Social Isolation and Loneliness: Prevalence, Epidemiology, and Risk Factors, Public Policy & Aging Report, Volume 27, Issue 4, 2017, Pages 127–130, https://doi.org/10.1093/ppar/prx030
Yanguas, J., Pinazo-Henandis, S., & Tarazona-Santabalbina, F. J. (2018). The complexity of loneliness. Acta Bio Medica: Atenei Parmensis, 89(2), 302.
Valtorta, N. K., Kanaan, M., Gilbody, S., Ronzi, S., & Hanratty, B. (2016). Loneliness and social isolation as risk factors for coronary heart disease and stroke: systematic review and meta-analysis of longitudinal observational studies. Heart, 102(13), 1009-1016.
LeRoy, A. S., Murdock, K. W., Jaremka, L. M., Loya, A., & Fagundes, C. P. (2017). Loneliness predicts self-reported cold symptoms after a viral challenge. Health Psychology, 36(5), 512.
Kroenke, C. H., Michael, Y. L., Poole, E. M., Kwan, M. L., Nechuta, S., Leas, E., … & Chen, W. Y. (2017). Postdiagnosis social networks and breast cancer mortality in the After Breast Cancer Pooling Project. Cancer, 123(7), 1228-1237.
Holt-Lunstad, J., Smith, T. B., & Layton, J. B. (2010). Social relationships and mortality risk: a meta-analytic review. PLoS medicine, 7(7), e1000316.
Russell, D., Peplau, L. A., & Cutrona, C. E. (1980). The revised UCLA Loneliness Scale: concurrent and discriminant validity evidence. Journal of personality and social psychology, 39(3), 472.
Bruce, L. D., Wu, J. S., Lustig, S. L., Russell, D. W., & Nemecek, D. A. (2019). Loneliness in the United States: A 2018 national panel survey of demographic, structural, cognitive, and behavioral characteristics. American Journal of Health Promotion, 33(8), 1123-1133.
Richey, S. (2010). The impact of corruption on social trust. American Politics Research, 38(4), 676-690.
Uslaner, E. M. (2012). Trust, diversity, and segregation in the United States and the United Kingdom. In Trust (pp. 69-97). Brill.
Rothstein, Bo, and Eric M. Uslaner (2005).
Vallier, K. (2020). Trust in a polarized age. Oxford University Press.
Zmerli, S., & Newton, K. (2008). Social Trust and Attitudes toward Democracy. The Public Opinion Quarterly, 72(4), 706–724. http://www.jstor.org/stable/25167660
Beugelsdijk, S., De Groot, H. L., & Van Schaik, A. B. (2004). Trust and economic growth: a robustness analysis. Oxford economic papers, 56(1), 118-134.
Subramanian, S. V., Kim, D. J., & Kawachi, I. (2002). Social trust and self-rated health in US communities: a multilevel analysis. Journal of Urban Health, 79(1), S21-S34.
Ross, Catherine E., John Mirowsky, and Shana Pribesh. “Powerlessness and the Amplification of Threat: Neighborhood Disadvantage, Disorder, and Mistrust.” American Sociological Review 66, no. 4 (2001): 568.
Keele, L. (2007). Social capital and the dynamics of trust in government. American Journal of Political Science, 51(2), 241-254.
OECD, O. (2013). Trust in government, policy effectiveness and the governance agenda. Government at a Glance, 2013.
Volunteer activity and financial donations are a force of good throughout our region
Nonprofits in Houston’s three-county region advance civic engagement not only by improving the condition of our residents and their communities but also through the strengthening of social ties among those who actively participate.
Why philanthropy and volunteering matter to civic engagement in Houston
A strong local nonprofit sector plays an essential role in building healthy communities — the ultimate goal of civic engagement. Not only do they provide critical services and resources to meet residents’ needs, but they also strengthen social connectedness across and among donors, volunteers and clients.1 The nonprofit sector provides opportunities for residents to actively participate in the betterment of their communities by volunteering time, talent, treasure or ties. Giving back to one’s community fosters a sense of community and has personal benefits. Studies have shown that participating in volunteer opportunities or making charitable donations can increase general life satisfaction, happiness, self-esteem and overall psychological well-being.2
The more we understand how Houstonians improve their communities through the nonprofit sector, we can work to create a region where everyone gives back.
The data
Almost half of residents donate $25 or more to nonprofits
When people feel connected to their community, they take action to protect and improve it.3 They work to better the condition of their neighbors. One way to do that is through donations to nonprofit organizations. According to the GivingUSA 2021 Report, Americans gave $471.4 billion in 2020. Individuals gave the most ($324 billion), followed by foundations ($89 billion). The region’s giving spirit has supported recovery efforts after multiple natural disasters in Houston, but on average, about half of residents give $25 or more to nonprofit organizations.
In the greater Houston region, nearly half of residents (48.8%) said they donated at least $25 to a charitable organization(s) in 2019. This is similar to the national average (50.5%) and slightly higher than the Texas state average (45.3%). When looking at other large metropolitan areas, Greater Houston is in the middle of the pack when it comes to charitable giving. A larger share of Houstonians donated to nonprofits compared to metropolitan areas such as Los Angeles, New York and San Antonio, but Houston lagged in giving rates compared to regions like Austin, Atlanta and Chicago.
In the greater Houston region, nearly half of residents (48.8%) said they donated at least $25 to a charitable organization(s) in 2019.
Residents of Houston’s three-county region have given an average of $4.4 billion a year to charitable organizations between 2011 and 2018. This is about roughly one-fourth of the donations made by Texans. Charitable giving tends to increase in times of disaster.4 Consequently, charities in Houston topped the list for the highest total contributions out of 30 major metros in 2017.
Most recently, reported giving levels have fluctuated widely, and are $3.6 billion in the 2018 tax year — down 37% from $5.7 billion in the year before. This decline can be attributed, in part, to a change in federal legislation that year that increased the standard deduction for charitable donations — total itemized deductions, as of 2018, must exceed $12,000 for individuals (up from $6,350 in 2017) and $24,000 for married couples (up from $12,700 in 2017). This change likely resulted in significant declines in the number of individuals who claimed contributions on their tax returns, and the overall amount — a trend seen nationally as well.
Households with higher incomes are more likely to make charitable contributions than their lower-income neighbors. Yet, fewer than half of households that earn more than $200,000 annually in Houston’s three-county region claimed charitable contributions in 2018.
While the aforementioned 2017 tax law decreased the total number of people who itemized, top earners still had an incentive to itemize. This could help explain why top earners have such a higher share of filers with charitable givings itemized.
Not surprisingly, reported levels of giving vary greatly by household income, with higher-income households donating more money than low-income households. But, giving also varies across the region. Households that earn $200,000 or more in Fort Bend County gave an average of $20,000 in the 2018 tax year. This is nearly half the average in Harris County ($38,661) and slightly lower than the average in Montgomery County ($24,301).
While the aforementioned 2017 tax law decreased the total number of people who itemized, top earners still had an incentive to itemize. This could help explain why top earners have such a higher share of filers with charitable givings itemized and the amount they gave.
Nonprofits in Houston are robust and provide critical services
Nonprofit organizations provide a variety of critical services, and therefore include a multitude of different types of organizations — private hospitals in the healthcare industry, chambers of commerce, private universities or organizations focusing on funding for schools, philanthropic foundations, and established charitable organizations who provide services to people and animals. Public charities in particular tend to play a vital role in strengthening communities as they have strong relationships with the people they serve — typically low-income and other historically marginalized communities — and possess unique understanding and knowledge of their community and their needs,5 particularly when the organization is led and staffed by people who share similar experiences with those they serve.
How many nonprofits are in Houston? Across the three-county area, there are a total of 15,660 nonprofit public charities — classified under section 501(c)(3) organizations by the IRS. The vast majority (12,509) are located in Harris County, with far fewer in Fort Bend (1,788) and Montgomery (1,363) counties. Religion-related organizations comprise the majority of nonprofits in Houston, followed by human services organizations that provide a broad range of social services. Overall, the three-county region has a higher share of religious nonprofit organizations and a smaller proportion of human services organizations compared to the state and nation.
Houston’s three county region has a reputation for being home to a large number of charitable organizations that provide important services to residents in need. However, the number of public charities per 10,000 residents is lower in each of our region’s three counties when compared to the state and national rates. This disparity may suggest that nonprofits in Houston are overwhelmed with demand, particularly when they are needed most — during times of crisis.
The number of public charities per 10,000 residents is lower in each of our region’s three counties when compared to the state and national rates.
COVID-19 disrupts steady rates of volunteering in Houston
The act of volunteering one’s time to better their community is a key behavior of civic engagement. Volunteering strengthens community ties and can spur additional forms of civic engagement such as advocating for public policy change or by inspiring Houston voters to get out and vote. Taking advantage of volunteer opportunities is not only important to organizations and communities, but also has a number of benefits for the volunteer. Volunteering can increase overall mental and physical health and have a positive effect on psychological well-being when done consistently and regularly.6
Between 2012 and 2020, at least 50% of residents in the three-county area had volunteered at least once in the last 12 months, according to the Kinder Houston Area Survey. However, between 2020 and 2021 the proportion of Harris County residents who volunteer fell 14 percentage points to 39.5%. This decline in volunteer rates is consistent with national trends as well. A study conducted by Fidelity found that two-in-three Americans surveyed either reduced or stopped previous volunteer activity due to the COVID-19 pandemic.7
Among those who volunteered in 2019, residents of the Houston metropolitan area volunteered at slightly lower rates than in Texas the U.S. overall. Of those who did participate in volunteering opportunities in Houston, over 60% do so at least once a month compared to roughly 70% for the state and the nation.
Schneider, J. A. (2007). Connections and disconnections between civic engagement and social capital in community-based nonprofits. Nonprofit and Voluntary Sector Quarterly, 36(4), 572-597.
Konrath, S. (2014). The power of philanthropy and volunteering. Wellbeing: A complete reference guide, 1-40.
Wang, L., & Graddy, E. (2008). Social capital, volunteering, and charitable giving. Voluntas: International Journal of Voluntary and Nonprofit Organizations, 19(1), 23.
Handy, F., Shier, M., & McDougle, L. M. (2014). Nonprofits and the Promotion of Civic Engagement: A Conceptual Framework for Understanding the “Civic Footprint” of Nonprofits within Local Communities. Canadian Journal of Nonprofit and Social Economy Research, 5 (1), 57-75. Retrieved from https://repository.upenn.edu/spp_papers/176
Piliavin, J. A., & Siegl, E. (2007). Health benefits of volunteering in the Wisconsin longitudinal study. Journal of Health and Social Behavior, 48(4), 450-464.
As significant contributors to our regional economy, small businesses provide income and wealth-generating opportunities for residents
Despite the pandemic’s immediate effect on the economy, small business growth in Houston’s three-county region remains strong. Yet, disparities persist for women and others who come from historically marginalized backgrounds.
Why small businesses matter to Houston
Small businesses, critical to economic and community development, are considered the lifeblood of our national, state and local economies. As major drivers of employment, small businesses and the entrepreneurs who run them are beneficial to our economy and stimulate growth by helping to lower poverty and reinvest in low-income areas.1 2 Small businesses also empower individuals and strengthen communities by employing and paying residents who spend their money in the community and increase the local tax base. Small businesses also provide income and wealth-building opportunities for people who may face larger employment barriers or discrimination, including immigrants, Black, Indigenous, and other people of color (BIPOC), and women.
However, barriers such as lack of credit access, social capital, and generational wealth have a disproportionate effect on aspiring female and BIPOC entrepreneurs, preventing their full contributions to the small business economy. The more we understand the systemic obstacles unique populations face in building small businesses, the more we can do to support their — and our region’s — collective success.
The data
Small business growth in Fort Bend and Montgomery counties outpaces Harris County
While the definition of small businesses can vary depending on industry, employee count, level of revenue, the U.S. Small Business Administration (SBA), defines a small business as one that is independently owned and operated, exerts little influence in its industry, and (with some exceptions) has fewer than 500 employees. According to the SBA, small businesses of 500 employees or fewer make up 99.9% of all U.S. businesses and created 17.3 million net new jobs between 1995 and 2021, accounting for nearly two-thirds of new net jobs created. A 2019 SBA report found that small businesses accounted for 44% of U.S. GDP.
Because nearly all businesses employ fewer than 500 people, and our geographic scope is regional, Understanding Houston focuses its analysis on businesses that employ between 1 and 9 people, inclusive. In 2022, there were nearly 14,000 small businesses (with fewer than 10 paid employees) in Fort Bend, 77,900 in Harris, and 10,700 in Montgomery counties. Between 2010 and 2022, the number of small businesses grew 101% in Fort Bend County, 22% in Harris County, 62% in Montgomery County, 27% in Texas overall, and 12% nationally.
At 78.9%, Fort Bend County had the highest percentage of businesses with fewer than 10 employees in Houston’s three-county region in 2022 — nearly four percentage points higher than in 2010. In Montgomery County, 73.4% of businesses employed fewer than 10 people. In comparison, Harris County (70.9%) had the lowest proportion of businesses with fewer than 10 employees in the area, which is slightly lower than the state and U.S. level.
Women-owned businesses in Houston decreased
Not only do small businesses create jobs and add to the economy, they provide wealth-building opportunities for and contribute to growth and vitality in local communities. In particular, creation of small businesses by immigrants, people of color, and women — sometimes a necessity to overcome employment barriers, challenges in building personal wealth, and discrimination — can help increase economic opportunity — a cornerstone of the American Dream. A 2022 study found that immigrants are about 80 percent more likely to found a business, compared to native-born citizens. Immigrant-owned firms also have about 1 percent more employees than those founded by U.S. natives, on average.3
Overall, the percentage of businesses with fewer than 10 paid employees are more likely to be owned by people of color (defined as anyone who does not identify as non-Hispanic white) in the nine-county Houston-The Woodlands-Sugar Land Metropolitan Statistical Area (Houston MSA) than in Texas and the U.S. overall.
In the Houston MSA, 38.5% of small businesses are owned solely by people of color, compared to 32.4% in Texas and 21.0% across the nation. In particular, Asian Americans are overrepresented among business owners — they own 22.2% of small businesses in the region, but comprise 8% of the MSA’s population. Additionally, the Houston MSA has a higher rate of Asian-American-owned small businesses than Texas (14.5%) and the U.S. (11.6%). The percentage of Hispanic-owned businesses was also much higher in the Houston MSA (11.2%) than the U.S. (7.3%), but slightly lower than in Texas (14.5%). More small businesses in Houston are also Black owned at 4.7% compared to Texas (3.0%) and the U.S. (2.8%).
In 2020, small businesses in the Houston MSA were slightly more likely to be owned by women compared to the state and the nation. In the Houston MSA in 2020, 24.6% of small businesses were owned solely by women compared to about 22% in Texas and the U.S. However, between 2020 and 2021, the percentage of women-owned small businesses in Houston decreased 8 percentage points from 25% in 2020 to 17% in 2021.
22%
of Houston-area small businesses are owned by Asian Americans, despite comprising 8% of the population.
More Houstonians work for themselves
Nonemployer businesses have no paid employees, annual business receipts of $1,000 or more, and are subject to federal income taxes. Most nonemployers are self-employed individuals (e.g., real estate agents, independent contractors) operating unincorporated businesses (known as sole proprietorships), which may or may not be the owner’s principal source of income. According to the Census Bureau, the majority of all business establishments in the United States are nonemployers, yet these firms average less than 4 percent of all sales and receipts nationally.
The number of nonemployer businesses in Fort Bend County increased 96% to 101,570 in 2021 from 2010 — the most rapid growth rate in Houston’s three-county region. In Montgomery County, nonemployer businesses grew 78% to 67,438in 2021 from 2010. Growth in Harris County (49%) was similar to Texas (48%); and the state and region outpaced the national growth rate (29%).
The over 680,000 nonemployer businesses in Houston’s three-county region generated nearly $36 billion dollars in revenue in 2021 — this is a 75% increase from 2010 — with the greatest growth in Fort Bend and Montgomery counties.
$36 billion
Revenue generated by Houston-area nonemployer businesses in 2021.
Rupasingha, Anil.” Locally owned: Do local business ownership and size matter for local economic well-being?” Federal Reserve Bank of Atlanta No. 2013-01 (2013).
Kugler, Maurice, Marios Michaelides, Neha Nanda, and Cassandra Agbayani. “Entrepreneurship in Low-Income Areas.” US Small Business Administration Office of Advocacy, 2018.
Azoulay, Pierre, Benjamin F. Jones, J. Daniel Kim, and Javier Miranda. 2022. “Immigration and Entrepreneurship in the United States.” American Economic Review: Insights, 4 (1): 71-88.
Good financial health is essential to economic security and upward mobility
Houston-area residents are more likely to be banked, have better credit access and quality, and be current on debt obligations than in the past. However, despite this improvement, the Houston region continues to lag behind the nation in key indicators of financial health, placing our most economically vulnerable residents at risk of financial exploitation.
Why debt and credit matter to Houston
Access to credit is vital for an individual’s and family’s economic stability and opportunity. The quality of our credit affects our ability to secure an apartment, get a job, obtain quality insurance, and acquire a loan for a home, business, vehicle, or education. For those facing financial constraints, the lack of credit (or the lack of good credit) can hinder opportunities for upward mobility, making it challenging to invest in one’s future, which perpetuates a cycle of economic insecurity. Conversely, for those with greater financial resources, accessing credit is a tool for leveraging opportunities and accumulating wealth through home or business loans.
People who lack a formal bank account, the unbanked, face greater challenges in accessing credit. Because they have been denied access to the traditional/official credit economy, unbanked individuals often resort to high-cost alternative financial services like payday lending, check cashing, etc. Individuals who use these services are more likely to face predatory lending in the form of high interest rates and struggle with repayments, which leads to excessive debt and traps the borrower in this cycle. This intensifies financial stress and limits the ability to save and plan for the future.
By ensuring credit access and promoting responsible lending practices, we foster economic empowerment, reduce financial vulnerability, and pave the way for long-term financial well-being for all Houston-area residents.
The data
Unbanked households in Houston are rising after years of decline
Accessing credit through the “official” credit economy (e.g., banks or credit unions), is optimal over utilizing non-traditional sources (e.g., check-cashing services, pawn shop loans, auto title loans, and paycheck advances/ payday loans), because it allows the credit holder expanded choices with greater flexibility, provides more favorable rates and fee levels, and can offer future rewards and benefits. However, people generally pursue these non-traditional routes because they have been denied access to traditional banking services.
Unbanked residents are those who rely on non-bank financial services such as check-cashing services, money orders, pawn shop loans, auto title loans, paycheck advances or payday loans to manage their finances. The unbanked are more likely to be younger, have lower incomes, less education, a disability, and identify as a person of color.1Being unbanked also poses financial disadvantages. For example, you cannot access any systems that require a bank account to activate, such as direct deposit from an employer.
Underbanked households have a checking or savings account with a bank or credit union but also use alternative financial services (e.g., check-cashing services, money orders, international remittances, pawn shop loans, auto title loans, paycheck advances or payday loans) to manage their finances.
Unbanked individuals often resort to high-cost alternative financial services.
Households in the nine-county Houston Metropolitan Statistical Area (MSA) are more likely to be unbanked than the overall rate in Texas and the U.S. About 1 out of 11 Houston-area households are unbanked compared to 1 out of 15 in Texas and 1 out of 25 nationally. An additional 17% in the Houston Metro Area are underbanked, meaning one out of four households in the region uses non-traditional financial services, putting them at risk of exploitation and predatory financing. About three-quarters of Houston-area households are fully banked.
1 out of 4 Households
in the Houston Metro Area accesses money and/or credit through check-cashing services, auto title loans, or paycheck advances/ payday loans.
Between 2017 and 2021, the percentage of unbanked households declined across the nation, state, and Houston metro. However, as of 2023, this rate has increased in Houston and across Texas. The Houston metro area’s share of unbanked households is more than twice that of the nation and slightly above Texas.
There are significant racial/ethnic differences among the fully banked. Black and Latino households are much less likely to be fully banked and more likely to use non-traditional/alternative financial services than their white counterparts for three significant reasons: discrimination, income disparities, and access levels.
Black and Latino families have experienced explicit exclusionary practices within the financial system, such as redlining, and continue to experience more implicit forms today. Consequently, these discriminatory and harmful practices have contributed to a legacy of mistrust in the mainstream financial system among many people from historically marginalized communities. Many traditional banks typically require account holders to maintain a minimum balance, but if that threshold is not met, they generally charge additional fees and penalties, and, ultimately, may close or deny future accounts altogether. Black and Latino families have lower access to traditional banks and more access to alternative financial institutions. Not only are there fewer bank branches in predominantly Black and Latino neighborhoods, but also there is a saturation of payday loan stores and check cashing outlets.3
About 16% of Hispanic households in the Houston metro area are unbanked, compared to about 4% of white households. As with unbanked households, there are significant differences in underbanked households by the race and ethnicity of the household. For example, about 1 in 5 Hispanic households in the Houston metro area are underbanked, compared to about 1 in 10 white households that are underbanked.
Compared to white households, Latino households in Metro Houston are 4 times more likely to lack a bank account.
Availability of credit in the Houston region improves, surpassing the state and nearing the national average.
Consumer spending patterns are closely linked to consumer confidence and overall economic health. Because credit drives and enables spending, access to credit tells us a lot about the overall economic well-being of our region and can be measured by the percentage of the population 15 years and older who utilize mainstream credit.
Mainstream credit refers to the full range of credit products that are typically reported to the nationwide credit reporting agencies that form the basis of your credit history and influence your credit score. A credit score is a numerical representation of an individual’s creditworthiness, which is used by lenders, creditors, and other financial institutions to evaluate the risk associated with extending credit or lending money. Credit scores are primarily based on an individual’s credit history, which includes factors such as payment history, amounts owed, length of credit history, types of credit, and recent credit inquiries.
In 2023, about 82% of adults in the Houston Metro Area used mainstream credit in the past 12 months performing about on par with the state of Texas for this indicator and slightly below the national average.
Having a credit file and credit score does not ensure timely access to credit. Revolving credit provides immediate credit at the credit-holder’s discretion. These lines of credit are called revolving credit because once made available, the credit is used, then paid for, and finally made available once again in a revolving cycle.4 Most people who participate in the credit economy have revolving credit in the form of a credit card or a home equity line of credit.
The percentage of adults who used revolving credit — in the form of a credit card — has increased by 10 percentage points in Texas and across the country since 2015. The Houston Metro Area saw this rate increase 17 points, and as of 2023 outperforms the state and is nearly on par with the nation overall. As of 2023, about three quarters of Houston metro residents have access to revolving credit in the form of a credit card.
Despite improvement, about a quarter of residents have a low credit score
Accessing credit through the “official” credit economy (traditional pathways such as banks or credit unions), is optimal over utilizing non-traditional sources (e.g., check-cashing services, pawn shop loans, auto title loans, and paycheck advances/ payday loans), because it allows the credit holder expanded choices with greater flexibility, provides more favorable rates and fee levels, and can offer future rewards and benefits.
However, people generally pursue these non-traditional routes because they have been denied access to the traditional/official credit economy, meaning these individuals are denied loans from traditional banks, are not issued credit cards, or don’t have valuable collateral to exchange. This leaves about 25% of our region with limited options while in a desperate situation. Not surprisingly, their vulnerability places them at greater risk of exploitation in the form of sky-high interest rates, exorbitant fees, and makes them more likely to need these services again.
Strong credit quality helps a family’s financial standing and positively impacts access to future credit that can allow a family to invest in wealth-building assets such as buying a home or building a business. Credit quality is determined by credit history and is measured by the percentage of individuals in the credit economy who have reliable payment history — meaning, they are consistently current on all financial obligations.
Falling behind on bill payments is a potential indicator of creditworthiness, providing insights into a household’s ability to satisfy its financial obligations and access different forms of credit. Across the Houston Metro Area, residents are about as likely to be current on all financial obligations as the average American with 87% of residents not falling behind on bill payments. Conversely, 13% of Houston area residents did fall behind on bill payments in 2023.
When debts are not paid on time, the credit holder’s credit score is lowered, which results in a reduction in access to future credit. Credit scores are used to evaluate the risk associated with extending credit or lending money, and they are based on an individual’s credit history, which includes factors such as payment history, amounts owed, length of credit history, types of credit, and recent credit inquiries.
Credit scores range from 300 to 850, with higher scores indicating “better creditworthiness.” A good credit score can help individuals secure better interest rates on loans, credit cards, and mortgages, as well as make it easier to rent an apartment or obtain certain types of employment.
Conversely, a low credit score can make it more difficult to obtain credit or result in higher interest rates, making borrowing more expensive. Individuals with a credit score below 660 are considered to have subprime credit. People who have subprime credit scores have limited options to access credit. The type of credit available to them is often high-risk because it comes with higher interest rates and exploitive repayment plans that can often trap individuals in a cycle of debt. Measuring the percentage of people with subprime credit has been used as an indicator of the health of Houston-area residents’ ability to access credit.
In 2023, Harris County had a higher rate of residents with a subprime credit score (i.e., below 660), with nearly 1 in 3, compared to Fort Bend and Montgomery counties where 1 in 4 residents had subprime credit scores. Fortunately, across all three counties the rate of residents with a subprime credit score has decreased by 5-6 percentage points since 2015 but have stagnated since 2021.
1 out of 3 Harris County residents
have subprime credit.
Medical debt in collections falls while student debt in default rises
Once we gain access to credit, we then hold a debt for that amount plus interest and any fees. Having debt is not necessarily a bad thing. Incurring debt can allow us to invest in something that has the potential to pay off later, build a positive credit history, give tax benefits, and more. Being in debt to buy a home, start a business, and pay for high-quality education or in-demand skills training have been identified as good investments that can increase one’s economic security and opportunity, including accumulating wealth.
However, unproductive debt is debt incurred to pay for basic needs and living expenses. We are more likely to accumulate unproductive debt during an unforeseen job loss or medical crisis, or because our current resources do not cover our expenses. Because it does not have the same long-term benefits, unproductive debt is riskier for the debt holder and society at large.5
An overreliance and dependence on credit can lead to the accumulation of unhealthy debt levels, which reduces the ability to make on-time full payments. When residents can’t meet payment obligations, they face additional fees and penalties, higher interest rates, lower credit scores, the potential loss of property such as vehicles and homes, and/or debt can go into collections. Debt goes into collections when the original creditor cannot collect payment on the debt, so they either sell or transfer the debt to a collections agency that tries to recover the money. Consequently, it becomes harder and more expensive to access credit.
Essentially, mounting debt sets into motion a cycle wherein individuals must use their earnings to pay overdue bills and interest, which leaves little funds for current expenses or future savings. Once begun, it is difficult to break out of this cycle of debt.
Total Debt
The percentage of individuals in the credit economy with debt in collections has consistently been much higher at the state (Texas) level, since 2017, compared to the national level. About 32% of Texans have debt in collections compared to 22% among all Americans. Texas — along with Louisiana, South Carolina, and Georgia — has the highest percentage of people with debt in collections in the nation. This finding is even more striking since Texas is the second-most populous state.
In Harris County, 34% of residents have debt in collections, the highest level in Houston’s three-county region. About 22% of people in Fort Bend County and 25% in Montgomery County also have debt in collections, which is closer to the national level.
1 out of 3
residents of Harris County with debt are in collections.
The percentage of individuals in the credit economy with debt in collections has declined nationally and in Texas since 2017. Between 2017 and 2023, the percentage of debt in collections fell seven percentage points in Fort Bend, nine points in Montgomery County, and ten percentage points in Harris County.
This decrease may be due to a combination of (1) the National Consumer Assistance Plan (NCAP) that was fully implemented in 2018 which changed reporting requirements and resulted in 8 million people having collections accounts removed from their credit report6; and (2) federal government action like mortgage and student loan forbearance implemented to mitigate the effects of the pandemic.7 In Texas specifically, the winter storm of 2021 also resulted in a large increase in mortgage forbearance in the state.8
Medical Debt
Medical debt refers to the share of people with a credit bureau record who have medical debt in collections. Texas has more people with medical debt in collections (9%) than the national rate (5%). Harris Montgomery counties have the highest share of debt holders with outstanding medical debt in the region (6%).
Texas saw a 17-percentage-point decrease in medical debt in collections between 2017 (26%) and 2023 (9%) but still remains slightly higher than the national average of 5%. Harris and Montgomery counties both saw a decrease of 12 and 13 percentage points, respectively, and both counties remain in line with the national percentage (5%).
The national decline in medical debt in collections is partially due to reforms in credit reporting practices. In 2022, credit-reporting companies removed medical debts in collections (that were eventually paid) from credit reports and extended the grace period for reporting unpaid medical debts from six months to one year. In 2023, medical debts in collection under $500 were excluded from credit reports entirely. It is estimated that within one year of these changes, more than 15 million Americans had their medical debt in collections erased from their credit reports and, as a result, roughly 27 million adults were able to increase their credit score from subprime (below 660) to near prime (between 601 and 660).5
Student Loan Debt
Student loan debt refers to the share of people with any student loan debt who are in default/debt in collections. While total and medical debt in collections have shown a decline, the past year has seen an increase in the rate of residents who have student loan debt in collections. About 15% of people in Texas and the nation are in this position, which is on par with regional rates.
Between 2017 and 2022, the percentage of student loan borrowers in default declined with Fort Bend County experiencing the largest reduction at 10-percentage points. However, rates of student loan defaults have increased, reversing past progress. As of 2023, Fort Bend County had the highest student loan default in the region at 17%.
The general downward trend in student loan defaults is largely due to the student debt loan relief implemented during the pandemic and extended through mid-2023.10 On March 13, 2020, the federal government granted forbearance on student loan payments toward eligible loans. Forbearance allows borrowers to pause or reduce debt payments during periods of hardship, without showing the loan delinquent on the credit report.11
Debt in Collections by Race/Ethnicity
As described in the Unbanked/Underbanked section above, the ability to access credit has historically been more fraught for people from historically marginalized communities, particularly for Black and Latino households. Because finance policies disproportionately harmed some groups while simultaneously benefiting others, disaggregating this indicator by race and ethnicity is helpful. Additionally, debt can often burden family and community well-being and reinforce the wealth gap between white and non-white communities of color.6
In each geography, ZIP Codes where at least 50% of the population identifies as Black, Indigenous, Asian, Hispanic, or another non-white group are much more likely to have debt in collections than white communities (where at least 50% of residents are white).
Across the nation in 2023, 29% of communities of color had debt in collections, compared with 19% of white communities. More than a third of the people who live in communities of color within Texas, Harris County, and Montgomery County have debt in collections. In 2023, the percentage of debt in collections for communities of color compared to white communities was 19 percentage points higher in Harris County, 13 points higher in Montgomery County, 6 points higher in Fort Bend County, 12 points higher at the state level, and 10 points higher at the national level.
More than a third of the people who live in communities of color within Texas, Harris County, and Montgomery County have debt in collections.
Small, M. L., Akhavan, A., Torres, M., & Wang, Q. (2021). Banks, alternative institutions and the spatial–temporal ecology of racial inequality in US cities. Nature Human Behaviour, 5(12), 1622-1628.
Ratcliffe, Caroline, Signe-Mary McKernan, Brett Theodos, Emma Kalish, John Chalekian, Peifang Guo, Christopher Trepel, An Opportunity and Ownership Brief. “Delinquent Debt in America.” Urban Institute Report, Washington, DC, Urban Institute (2014).
Too many Houston-area families are stuck in the cycle of intergenerational poverty, preventing economic mobility
Despite a slight decline in poverty rates over the last decade, over one million households in Houston’s three-county region struggle to afford basic necessities.
Why poverty and economic mobility matter to Houston
Poverty has devastating consequences for individuals and families, entire communities, and our collective future. People who live in communities with high concentrations of poverty are at higher risk for cognitive1 2 and mental/ behavioral health challenges,3 chronic disease,4 higher mortality,5 and lower life expectancy.6 7 Children that grow up in poverty have higher prevalence of developmental delays,8 9 toxic stress,10 and chronic illness;11 they are also more likely to leave high school without a diploma,12 have fewer job prospects,13 or interact with the criminal system.14 Individuals who experience poverty as a child are more likely to experience poverty into adulthood, which contributes to intergenerational cycles of poverty.15 Intergenerational poverty not only prevents many from achieving their full potential, but also it holds back our collective society because we can’t benefit from the full talents and participation of our region’s most valuable asset — our people.
By working together to lift our neighbors out of poverty and into economic security, we can build a more vibrant Houston region with opportunity for all.
The data
Despite declining poverty rates since 2010, 54,000 more Houstonians live in poverty
The Official Poverty Measure was developed in the mid-1960s by Mollie Orshansky, an economist at the Social Security Administration, to measure the Lyndon B. Johnson Administration’s success in its “War on Poverty.” Her formula was derived from the cost of a minimum food diet for different family sizes, which she believed accounted for a third of a family’s overall budget. Orshansky concluded, if a family earned less than three times the cost of food, then they lived below the poverty threshold. Today’s measure is still based on this original calculation and is updated annually for inflation.
This measure, while consistent over decades, has limitations: It does not account for geographic cost-of-living differences — the threshold is the same regardless of where one lives in the continental United States; supplemental income such as tax credits, housing vouchers, or Medicare is not considered part of income; and the definition of a “family” is narrowly defined.16 According to the U.S. Census Bureau, “The official poverty measure is based on pretax cash income, while the Supplemental Poverty Measure (SPM) includes noncash benefits such as the Supplemental Nutrition Assistance Program (SNAP) and housing subsidies as well as net income after payroll taxes, tax credits and other necessary expenses.”
In 2023, the Federal Poverty Line, or poverty threshold, was $15,060 for an individual and $31,200 for a family of four. Based on this definition, 40.8 million Americans lived below the poverty level. Comprising 13% of the population, 1 out of 8 Americans live in poverty, according to the official measure.
1 out of 8
Americans live in poverty.
In 2023, the poverty rate was 9% in Fort Bend, 16% in Harris, and 11% in Montgomery County. In Houston’s three-county region, the poverty rate is consistently lowest in Fort Bend County and highest in Harris County. Nearly 924,000 Houston-area residents lived below the poverty line in 2023.
Over the last decade, poverty rates in each Houston-area county steadily declined from 2010 to a decade-low in 2019, before ticking back up in 2021. Between 2010 and 2019, the share of people living below the poverty line fell by 2.8 percentage points in Fort Bend, 3.6 points in Harris, and 2.6 points in Montgomery counties. Between 2021 and 2023, poverty rates remained flat in Harris County, fluctuated in Montgomery County but ultimately ticked down by nearly one point, and increased 2.1 percentage points in Fort Bend County.
While the percentage of Houston-area residents who live in poverty is lower in 2023 than in 2010, the number of people living in poverty has increased during this period. As of 2023, the number of people living in poverty was 81,000 in Fort Bend County, 767,000 in Harris County, and 76,000 in Montgomery County.
924,000
Houston-area residents live below the poverty line.
Racial characteristics of poverty in Houston’s three county region
In the United States, poverty and race are strongly connected,17 with poverty rates generally highest among the Black population and lowest among the white population (among the four largest racial/ethnic groups). That this disparity exists in nearly every state and county in the nation, suggests that this lack of equality can be attributed more to the institutional disadvantages and discrimination that has been embedded into the various systems that guide American life — education, healthcare, housing, employment — than to individual characteristics.18
Exacerbating racial/ethnic disparities, Black families are 16 times more likely to have lived in poverty for at least three generations compared to white families, according to an analysis from Brookings Institution. One in five Black Americans (21.3%) are experiencing poverty for the third consecutive generation, compared to one in a hundred white Americans (1.2%).
Black families in the U.S. are 16 times more likely to have lived in poverty for at least three generations compared to white families.
A 2024 Opportunity Insights paper reveals that while significant racial disparities do still exist, the national Black-white mobility gap has shrunk by nearly 30% in the past 15 years. Comparing two birth cohorts, people born in 1978 and 1992, this study found that Black children born to low-income (25th percentile) parents in 1992 earned more as adults than those born in 1978. Meanwhile, white children from similar backgrounds saw a decline in earnings across cohorts. However, disparities remain. On average, the earnings gap between Black and white adults who grew up in low-income families is $13,000. We see a similar trend in median household income by race and ethnicity regionally and for the state and nation where racial disparities in income do still exist but these gaps have narrowed between 2010 and 2023.
In 2023, 9.4% of white Americans nationwide lived in poverty, while the figures were 20.8% for the Black population, 16.7% for the Hispanic population, and 9.9% for Asian Americans. Poverty rates in Harris County and Texas closely mirror these national statistics.
In Fort Bend and Montgomery counties, the poverty rate is highest among the Hispanic population at 12.4% and 17.0% respectively. In Harris County, Black residents experience the highest poverty rate (21.2%), which is more than triple the rate for white residents (6.9%), followed closely by Hispanics (20.6%).
In Montgomery County, the proportion of the Hispanic population living below the poverty threshold fell by 8.7 percentage points between 2010 and 2023 — the greatest decline among racial/ethnic groups in the county—followed by a 5.3-percentage-point decline for the Black population in Montgomery County. In Harris County, Hispanic residents experienced the greatest declines in poverty rates (5.8 percentage points), followed by Asian Americans (5.5-percentage-point decline). In Fort Bend County, the poverty rate fell by 3.5 percentage points among Black residents and 3.1 for Hispanic residents compared to a 3.9-percentage-point increase for Asian American residents in Fort Bend County. Across all three counties between 2010 and 2023, the poverty rate for white residents was stagnant.
Single-parent families and poverty in Houston’s three-county region
Across the United States, the percent of families led by single parents declined from around 15% in 2010 to 13% in 2023. Locally, the share of families led by single parents in 2023 was 9% in Fort Bend County, 16% in Harris County, and 11% in Montgomery County. However, despite the declining rates, the number of single-parent led families in Houston’s three-county area has increased in the last decade because of the area’s growing population. The increase in this family structure is a concern because families led by single parents are five times more likely to live below the poverty threshold than two-parent-households. Among single-parent families in the United States, 70% are headed by women; and nearly 1 in 3 (32.2%) households led by single-moms lives in poverty compared to 1 in 18 (5.7%) households led by married couples.
In Harris County, 37% of single-mom families with children under 18 live in poverty — nearly 4 times the rate of married-couple families but a 5-percentage-point decreased compared to over a decade ago. In Montgomery County, the rate of single-mom families with children living in poverty is roughly five times that of married-couple families and has experienced a smaller decrease of 2 percentage points. We see the same gap in Fort Bend County between single-mom and married-couple families but the rate of single-mom families with children living in poverty has not improved over time although it is the lowest in the Houston three-county region.
Nearly one out of four children in Harris County lives in poverty
Research has shown that children growing up in poverty are more likely to face chronic stress and conditions that leave permanent changes in their brains, with implications for learning, health and behavior.19 Children who have lived many years in poverty are 90% more likely than their peers who never lived in poverty to enter their 20s without completing high school and, for girls, are four times more likely to become a teen mother setting the stage for the intergenerational transmission of disadvantage and onset of chronic poverty.20
Poverty rates for children are typically higher than for adults. The proportion of children under 18 living in poverty in 2023 was 10.4% in Fort Bend, 23% in Harris, and 15% in Montgomery County. Fort Bend and Montgomery counties have lower rates of children living in poverty compared to the state (18.4%) and the nation (16%) while Harris County has a higher rate.
1 out 4
Children in Harris County lives in poverty
Between 2010 and 2023, poverty rates for children under 18 have declined more than 5 percentage points across the nation, with the greatest declines occurring between 2010 and 2019. Between 2019 and 2021, poverty rates ticked back up in each county, the state, and nation — and in the case of Montgomery County, reversed all gains from the previous decade. As of 2023, the poverty rate in all three counties remains higher than it was in 2019.
Poverty rates for children 5 and under are even higher than they are for all children although this difference has decreased over the years. The proportion of children 5 and under living in poverty in 2023 was 10.5% in Fort Bend, 23.7% in Harris, and 15.1% in Montgomery County. Poverty trends for children 5 and under steadily declined between 2010 and 2019, but then ticked up during the pandemic, according to 2021 data. Between 2010 and 2023, poverty rates for children 5 and under decreased more across the state (-9.4 percentage points) and the nation (-8 points) compared to a decrease of 4.5 points in Fort Bend, 6.6 points in Harris, and 7.7 points in Montgomery counties.
In 2023, 10.0% of white children under 18 were experiencing poverty across the nation, compared to 29.3% of Black children, 21.6% of Hispanic children and 10.0% of Asian American children. The poverty rate for non-white children under 18, and children overall, in Harris County exceeds both national and state levels, while the rate of white children experiencing poverty in Harris County is lower.
Number of youths aged 16 to 19 neither working nor pursuing education decreases in Montgomery County and across the U.S.
Young people between the ages of 16 and 24 who are not enrolled in school or not working are classified as “opportunity youth.” Once a young person becomes disengaged from school or work, it becomes increasingly difficult to reconnect them to opportunities in education and skill development.21 Being disconnected is both a consequence and a cause of poverty, and opportunity youth are twice as likely to live in poverty as their connected peers and are less likely to be employed, own a home, or report good health when they reach their thirties.22
Approximately 8% of the 16-to-19-year-old population are neither working nor attending school in Texas, a higher share compared to the national average (6.9%). Fort Bend and Montgomery counties have the lowest rate of 16-to-19-year-olds considered opportunity youth at 5.8% and 5.1% respectively compared to 8.7% in Harris County. Between 2010 and 2022, the proportion of youth neither in school nor working decreased the most in Montgomery County by 3.1 percentage points. However, the number of opportunity youth increased in Fort Bend and Harris counties by 32% and 2% respectively while the number decreased by 9% in Montgomery County. This is compared to a 4% increased in the number of opportunity youth across the state and a 17% decrease across the nation.
One out of three Houston-area households experience ALICE
Because the Official Poverty Measure has such a low financial threshold, it is not a strong indicator to assess a population’s overall level of economic security. Although many believe that having a full-time job with a steady income allows someone to overcome poverty, the reality is that many full-time workers struggle to make ends meet. Indicators that take into consideration more realistic costs of living show that many working families are struggling.
The acronym ALICE stands for Asset Limited, Income Constrained, and Employed. It represents families that are working but unable to afford all their basic necessities like housing, food, childcare, health care and transportation.ALICE income thresholds include a more realistic cost of living than federal poverty guidelines.
To put things in perspective, the Texas cost-of-living in 2022 was $72,816 for a family of four and $26,268 for a single adult, which are both significantly higher than the Federal Poverty Level of $29,950 for a family of four and $14,880 for a single adult in 2022. ALICE income thresholds across all three counties indicate that a more realistic “survival budget” for a family of four is at least $78,012. With Harris County’s median household income below this threshold, it is no surprise we see higher portions of ALICE households in Harris County than in either Montgomery or Fort Bend counties.
Nearly one in three Houston-area households were classified as ALICE (Asset Limited, Income Constrained, Employed) in 2022, which is slightly higher than the state (29%) and national rate (29%). The proportion of households classified as ALICE was 27% in Fort Bend, 32% in Harris, and 27% in Montgomery counties. This is on top of the percentage of households that live below the Federal Poverty Line.
44%
of Houston-area households struggle to afford their basic needs.
Over one million households (44%) in Houston’s three-county region either live below the poverty threshold or experience ALICE. While the number of households in poverty increased between 2010 and 2022 in the three-county region by 24%, the number of ALICE households increased at a much faster rate during the same period by 49% primarily as a result of rising costs and stagnant wages.
Economic mobility in the Houston area
Economic mobility, or intergenerational mobility, measures the percentage of children who grow up to earn more than their parents. To a great extent, it is a central component of the “American Dream.” It reflects the aspiration that through hard work and determination anyone can achieve their highest goals and fullest potential.
Per Opportunity Insights, a Harvard-based research nonprofit that conducts scientific research on how to improve upward mobility, more than 90% of children born nationally in the 1940s grew up to earn more than their parents. But over the past 50 years, this rate has been in decline, and is now only 50%, contributing to growing income inequality across the country. Research from Opportunity Insights shows upward economic mobility largely depends upon where one lives during childhood and the type of resources their family possesses. Children raised in low-income families have a much harder time securing higher incomes in adulthood.
The discrepancies illustrated by the Opportunity Atlas tool help to shed light on how different neighborhoods shape the development of human capital and support economic growth.23 A rigorous study found that the longer a child lived in a lower-poverty environment (defined as having a poverty rate below 10%) during childhood, the higher their chance to have better long-term outcomes.24 By moving families to a high mobility neighborhood that has a low poverty rate, more stable family structures, greater social capital, and better school quality, children from those families can make income gains in adulthood. The research suggests the need for a holistic approach to reduce racial disparities and improve upward mobility for all.
Economic mobility outcomes by income
The maps below show economic mobility as the future incomes for children from low-income families, with red indicating lower future earnings while blue shows higher earnings. Across the country this map shows that economic mobility for children of low-income parents is lowest in the southeastern region of the U.S. and highest in the northern region.
In Harris County, for example, the average child born between 1978 and 1983 from a low-income family (defined as families at the 25th percentile of household income) earns a household income of $33,000 at age 35. A low-income child of the same birth cohort in Fort Bend County earns $35,000 a year, and in Montgomery County earns $36,000 a year. In all three cases, the average child barely improves upon the income of the household in which they grew up.
Within each county, one’s childhood ZIP code can tell a great deal about expected outcomes. On average, a child from a low-income family raised in Bellaire, a high-income community in Southwest Harris County, surrounded by a peer group from a higher-income bracket has a much greater chance of earning a higher household income (over $40,000) than a low-income child raised in Fifth Ward ($23,000), a low-income community just north of downtown Houston. Similarly, a child from a low-income family who grew up in New Caney, between I-45 and I-59 in Northeast Harris County, earns a household income of $33,000 as an adult, compared to a low-income child from The Woodlands, a wealthy township in south Montgomery County, making around $50,000.
A child from a low-income family, defined as families in the 25th percentile of household income, raised in Greater Third Ward, a high-poverty area just south of downtown Houston, and a child raised in North Forest, a low-income community in Northeast Houston between 610 and beltway 8 loops, have equal chances of earning a household income of $20,000 in adulthood
Household income at age 35 for children of low-income parents by neighborhood/census tract where they grew up in Harris County.
This Mobility Outcomesmap created by Opportunity Insights allows us to explore how economic mobility across the nation differs by place, race, gender, and class. In the summer of 2024, Opportunity Insights built upon this initial research and created the Mobility Trends map, which allows us to see how economic mobility is, or isn’t, improving over time and for whom.
On the left, the Mobility Outcomes map shows economic mobility as the future incomes for children from low-income families, with red indicating lower future earnings while blue shows higher earnings. Across the country this map shows that economic mobility for children of low-income parents is lowest in the southeastern region of the U.S. and highest in the northern region.
On the right, the Mobility Trends map, building on the Mobility Outcomes map, shows changes in economic mobility on the county-level by comparing income differences, over time, of adults born into similar places and circumstances. Like the Mobility Outcomes map, areas that show the greatest improvements in economic mobility are shaded in blue while places with deteriorating economic mobility are shaded in red.
Are the future incomes of children born into low-income families in 1992 higher than the future incomes of similar children born in 1978? It depends. Nationally, the future income of children from low-income (25th percentile) families born in 1992 is 4.2% lower than similar children born in 1978. This is compared to it being stagnant for children born to high-income (75th percentile) parents suggesting increasing class gaps at the national level.
In our three-county region, the change in economic mobility (the difference in adult earnings between those born in 1992 and those born in 1978) stagnated for children born to low-income and children born to high-income parents.
However, comparing changes in economic mobility for children born to the lowest-income (1st percentile) and highest-income (100th percentile) parents tells a much different story.
Economic mobility for children born to the lowest-income parents has increased by 2% in Montgomery County while it has not changed in Fort Bend and Harris counties. For children born to the highest-income parents, there was an increase of 6.1% in Fort Bend County, 6.7% in Harris County, and 4% in Montgomery County, pointing to an increasing income gap across our region between children born to the lowest- and highest-income households.
Economic mobility outcomes by race
Economic mobility can affect subgroups in the same neighborhood in different ways, shedding light on some racial and class-based disparities. For example, the average Black child from a low-income family in Fort Bend County earns a household income of $27,000 in adulthood, compared to $44,000 for the average white child from a low-income family. Similarly, a Black child from a low-income family raised in Montgomery County earns a household income of $25,000, compared to a white child from a low-income family making $39,000.
This dataset has also shown downward mobility varies by race. Black boys who grow up in America, even from an affluent family and live in a high-income neighborhood, still earn less in adulthood than white boys with similar backgrounds.25 Moreover, white boys from affluent families are more likely to stay wealthy in adulthood while Black boys from similar families are more likely to become poor rather than retain their socioeconomic status as adults.
Economic mobility trends by race
The newest addition to Opportunity Atlas—the Mobility Trends map—shows that while racial disparities in economic mobility still exist, they have shrunk over time while gaps by income level have widened. This study reveals that the national income gap between white children from low-income (25th percentile) and high-income (75th percentile) households has widened by 30%, while the earnings gap between white and Black children from low-income households has shrunk by the same amount.
However, white children from low-income families still earn, on average, $13,000 more in adulthood than Black children in similar situations. Additionally, the Black-white economic mobility gap narrowed mainly due to improvements in Black children’s chances of moving out of poverty, not their likelihood of reaching the upper class. Black children born into the lowest income quintile in 1978 were 15 times more likely to remain there compared to white children—this gap decreased by 4.1 percentage points for those born in 1992. However, the likelihood of a Black or white child born into a low-income family reaching the top income quintile has not changed.
Our three-county region mirrors national trends with the income gap between white children born to low-income and high-income parents widening by 36% in Fort Bend County, 30% in Harris County, and 18% in Montgomery County. Similarly, the income gap between white and black children from low-income families has decreased by 42% in Fort Bend County, 35% in Harris County, and 31% in Montgomery County. However, disparities persist with a future earnings gap of $7,500 between white and Black children born into low-income families in 1992 in Fort Bend County and a gap of $8,200 in Harris and Montgomery counties.
Mullainathan, S., & Shafir, E. (2013). Scarcity: Why having too little means so much. Macmillan.
Shiv, B., & Fedorikhin, A. (1999). Heart and mind in conflict: The interplay of affect and cognition in consumer decision making. Journal of consumer Research, 26(3), 278-292.
Belle, D., & Doucet, J. (2003). Poverty, inequality, and discrimination as sources of depression among U.S. women. Psychology of Women Quarterly, 27(2), 101-113. https://doi.org/10.1111/1471-6402.00090
Shaw KM, Theis KA, Self-Brown S, Roblin DW, Barker L. Chronic Disease Disparities by County Economic Status and Metropolitan Classification, Behavioral Risk Factor Surveillance System, 2013. Prev Chronic Dis 2016;13:160088. DOI: http://dx.doi.org/10.5888/pcd13.160088
Mode, N. A., Evans, M. K., & Zonderman, A. B. (2016). Race, neighborhood economic status, income inequality and mortality. PLoS ONE, 11(5), e0154535. https://doi.org/10.1371/journal.pone.0154535
Singh, G. K., & Siahpush, M. (2006). Widening socioeconomic inequalities in US life expectancy, 1980–2000. International Journal of Epidemiology, 35(4), 969–979. https://doi.org/10.1093/ije/dyl083
Braveman, P. A., Cubbin, C., Egerter, S., Williams, D. R., & Pamuk, E. (2010). Socioeconomic disparities in health in the United States: What the patterns tell us. American Journal of Public Health, 100(Suppl 1), S186–S196. https://doi.org/10.2105/AJPH.2009.166082
Eamon, M. K. (2001). The effects of poverty on children’s socioemotional development: An ecological systems analysis. Social Work, 46(3), 256–266.
Justice, L. M., Jiang, H., Purtell, K. M., Schmeer, K., Boone, K., Bates, R., & Salsberry, P. J. (2019). Conditions of poverty, parent-child interactions, and toddlers’ early language skills in low-income families. Maternal and Child Health Journal, 23(7), 971–978. https://doi.org/10.1007/s10995-018-02726-9
Evans, G. W., & Kim, P. (2013). Childhood poverty, chronic stress, self-regulation, and coping. Child Development Perspectives, 7(1), 43–48. https://doi.org/10.1111/cdep.12013
Council on Community Pediatrics, Gitterman, B. A., Flanagan, P. J., Cotton, W. H., Dilley, K. J., Duffee, J. H., Green, A. E., Keane, V. A., Krugman, S. D., Linton, J. M., McKelvey, C. D., & Nelson, J. L. (2016). Poverty and child health in the United States. Pediatrics, 137(4), e20160339. https://doi.org/10.1542/peds.2016-0339
Baydu, M. M., Kaplan, O., & Bayar, A. (2013). Facing the influence of poverty on graduation rates in public high schools. Procedia-Social and Behavioral Sciences, 84, 233-237.
National Academies of Sciences, Engineering, and Medicine; Division of Behavioral and Social Sciences and Education; Committee on National Statistics; Board on Children, Youth, and Families; Committee on Building an Agenda to Reduce the Number of Children in Poverty by Half in 10 Years; Le Menestrel S, Duncan G, editors. A Roadmap to Reducing Child Poverty. Washington (DC): National Academies Press (US); 2019 Feb 28. 3, Consequences of Child Poverty. Available from: https://www.ncbi.nlm.nih.gov/books/NBK547371/
Jarjoura, G. R., Triplett, R. A., & Brinker, G. P. (2002). Growing Up Poor: Examining the Link between Persistent Childhood Poverty and Delinquency. Journal of Quantitative Criminology, 18(2), 159–187. http://www.jstor.org/stable/23366800
Williams, D. R., Mohammed, S. A., Leavell, J., & Collins, C. (2010). Race, socioeconomic status, and health: Complexities, ongoing challenges, and research opportunities. Annals of the New York Academy of Sciences, 1186(1), 69–101. https://doi.org/10.1111/j.1749-6632.2009.05339.x
Mendelson, T., Mmari, K., Blum, R. W., Catalano, R. F., & Brindis, C. D. (2018). Opportunity Youth: Insights and Opportunities for a Public Health Approach to Reengage Disconnected Teenagers and Young Adults. Public health reports (Washington, D.C. : 1974), 133(1_suppl), 54S–64S. https://doi.org/10.1177/0033354918799344
Strong job and industry growth are essential to increasing economic opportunity and security for all Houstonians
Houston’s three-county region continues to have strong jobs and industry growth over the last decade.
Why employment matters to Houston
A growing, skilled workforce and strong job growth are critical to continuous economic growth. In theory, when jobs are created in a region, skilled workers move in, our population expands, wages rise, more people spend more money, employment grows, unemployment falls, and a variety of positive social impacts follow.1 However, the reality is that not all Houstonians benefit equally from a strong economic cycle. The vitality of the region’s economy — and the livelihood of its residents — depends on our ability to operate an effective and inclusive economy that appropriately educates and trains our future and current workforce and produces jobs that provide a good standard of living.
When we invest in and meaningfully support all adults to fully participate in our region’s economic prosperity, we will see significant — and inclusive — economic growth.
The data
Houston-area unemployment rates hold steady from 2022 to 2023
The unemployment rate measures the share of workers in the labor force who do not currently have a job but are actively looking for work. The level of unemployment is a general measure of how the overall economy is operating, and changes in the rate can be an important signal of changes in the labor market and economy.
During the Great Recession in 2010, unemployment rates in Fort Bend and Montgomery counties were at a 30-year high but steadily declined to a two-decade low in 2019. Of course, unemployment rates spiked in 2020 — the result of pandemic-related job losses. However, between 2020 and 2022, unemployment rates declined significantly returning to pre-pandemic levels and have remained flat since then. In 2023, the unemployment rate in Harris County (4.3%) was highest in Houston’s three-county region, while the unemployment rate was 4.0% in Fort Bend and 3.9 in Montgomery counties.
5 percentage-point decrease
in Harris County’s unemployment rate between 2020 and 2022.
Job growth in Houston’s three-county region is positive but slower from 2022
Job growth is a key indicator of economic expansion and a strong job market. As a leading economic indicator, robust job growth typically signals a healthy economy.
The COVID-19 pandemic severely affected job availability with all three counties, the state, and the nation experiencing the greatest decline in jobs in 2020 than in at least the last decade. Recovery began in 2021, and by 2022, job growth reached its highest levels in years. However, between 2022 and 2023, job growth stagnated or declined with Fort Bend County experiencing the sharpest decline in job growth decreasing by eight percentage points.
8 percentage-point decrease
in Fort Bend County’s job growth between 2022 and 2023.
Even so, Fort Bend and Montgomery counties continued to experience strong job growth between 2022 and 2023 at about 5% outpacing job growth across Texas (3%) and the U.S. (2%). Looking at trends over a longer period of time between 2010 and 2023, job growth in Fort Bend (88%), Montgomery County (77%), and Harris County (21%) outpaced the nation overall (19%).
Industries in Houston see steady, consistent growth
Texas and Houston’s three-county area continue to be a place of business opportunity and growth. According to the Greater Houston Partnership, which provides economic data and analysis for the nine-county Houston-The Woodlands-Sugar Land Metropolitan Statistical Area (Houston MSA), found that the region ranks third in the number of Fortune 500 headquarters, and Texas has ranked the best state for business for 19 years in 2023.
Between 2010 and 2023, Houston’s three-county region saw the greatest growth in businesses in the following industries: education and health services,leisure and hospitality, and professional and business services. Growth in Houston-area businesses has occurred in each of the three counties, with Fort Bend and Montgomery counties experiencing the fastest businesses growth — mirroring their rapid population growth. While it may appear that Harris County business growth has slowed, the lower growth rates are more a reflection of a large, existing set of businesses already in Harris County, and so while growth continues for the county, its relative growth is smaller compared to its rapidly growing neighbors.
Fort Bend County has doubled the number of business establishments between 2010 and 2023, with the greatest growth in professional and business services (136% increase), followed closely by information (132% increase) and education and health services (130% increase), and then leisure and hospitality (113% increase).
In Harris County, the number of establishments increased by 25% from 2010 to 2023 — a slower growth rate given the volume in the third most populous county in the nation. Among the largest three industries, establishments in education and health services grew the most (61% increase), followed by leisure and hospitality (44%), and professional and business services (34%).
The number of establishments in Montgomery County grew by 75% between 2010 and 2023. Among the largest three industries, establishments in education and health services grew the most (115%), followed by information (104%), and professional and business services (94%).
The top Houston-area job is in office and administrative support
The type of work people do, or occupational mix, is important to understanding the economy of a region. Changes in occupation often reflect business innovations. When a business adopts new technology, produces new products, or makes other changes to its processes, doing so usually causes changes in occupational mix. For example, if a factory automates, the number of production workers usually declines, while the number of engineers increases.2
There have been five major shifts in the occupational mix in U.S. history: the decline of agricultural employment (1870 to 1970), the rise of office work (1870 to 1970), the decline of manual labor (1940 to 1970), the decline of production work (1950 to 2010), and the rise of management (1970 to 2005).3
The top Houston-area job in each county is in office and administrative support, and while the counties share commonalities in occupational mix, there are notable differences. In Fort Bend County, most people are employed as office and administrative support (12%), educational instruction (10%), food prep and serving (10%), sales (10%) and transportation/warehouse (10%). In Harris County, most residents are employed as office and administrative support (12%) and transportation/warehouse (10%), reflecting the significance of trade in Houston — which is a major distribution center for the nation and globe, as the port of Houston is the top foreign trading port in the U.S. by weight. In Montgomery County, most workers are employed as office and administrative support (13%), food prep and serving (11%), and sales (10%).
More than half of Houston-area jobs pay more than $40,000 annually
Availability of jobs is crucial, but it is equally important that those jobs offer fair and livable wages. The Census categorizes jobs as low-wage (i.e., jobs that pay $15,000 or less annually), medium-wage, and high-wage, with “high-wage” jobs being any work that earns more than $40,000 annually. An individual earning more than $40,000 annually is living above the Federal Poverty Line, however, they are not earning enough to make ends meet given the line’s rudimentary determination.
Based on the Census definition, 58% of jobs in the three-county area are classified as “high-wage” positions, in that they pay more than $40,000 annually. When comparing across the three-counties, Harris County has the largest percentage of residents working in a high-wage job (59%) compared to Fort Bend County (47%) and Montgomery County (53%). Between 2005 and 2022, the number of “high-wage” jobs increased 211% in Fort Bend, 106% in Harris, and 328% in Montgomery counties and 119% in Texas overall.
About 16% of the three-county area residents are in low-wage jobs ($15,000 or less annually). About 21% of workers in Fort Bend County, 18% in Montgomery County, and 15% in Harris County are in low-wage jobs. This means that 1 in 6 workers in the region work at least 40 hours a week, yet bring home less than $1,250 a month.
1 out of 6
Houston-area workers have low-wage jobs that earn $15,000 or less annually.
Resources
References:
Bartik, Timothy J. 2014. “How Effects of Local Labor Demand Shocks Vary with Local Labor Market Conditions.” Upjohn Institute Working Paper 14-202. Kalamazoo, MI: W.E. Upjohn Institute for Employment Research. https://doi.org/10.17848/wp14-202
Elvery, Joel A. 2019. “Changes in the Occupational Structure of the United States: 1860 to 2015.” Federal Reserve Bank of Cleveland, Economic Commentary 2019-09. https://doi.org/10.26509/frbc-ec-201909