
There is more to economic security than living above the poverty line.
Across Greater Houston, more than a million households struggle to make financial ends meet. Among those households across Fort Bend, Harris and Montgomery counties, about 306,000 live below the Federal Poverty Level (FPL). However, this common economic measure only describes part of the economic reality in our community. The Asset Limited, Income Constrained, Employed (ALICE) data presents a more accurate picture of the economic reality across our community, especially regarding the number of households that are economically challenged.
What is ALICE?
According to the 2023 ALICE report for Texas by United For ALICE, 700,000 households across Fort Bend, Harris and Montgomery counties, or 31%, experienced ALICE in 2021 – they worked hard but couldn’t afford the basic necessities of life. The ALICE Report draws attention to the huge but often hidden segment of our community that is struggling to make ends meet, beyond those living on incomes below the FPL.
The ALICE data takes into consideration the ALICE Survival Budget, which is a bare-bones, real-world, conservative estimate for what it takes to make ends meet. It includes actual costs, such as housing, utilities, child care, food, transportation, health care, and a low-cost smartphone, and it changes based on the county of residence and size and composition of the household. Noticeably missing from the ALICE Survival Budget is the ability to save for emergencies or a rainy day. Individuals and families experiencing ALICE often feel the stress of living paycheck to paycheck and are one emergency away from financial hardship.
The ALICE Survival Budget highlights how a single adult in Harris County, for example, needed an annual income of $32,328 to afford the basics in 2021, while a family of three (one adult with one preschooler and one school-aged child) needed $61,548. In contrast, the FPL for a single adult was $14,583 and for a family of three was $24,860 in 2023 – a 121% and 148% difference, respectively. The individuals and families who earn above FPL but still can’t afford everything are often not eligible for assistance programs, public benefits, and other supports.
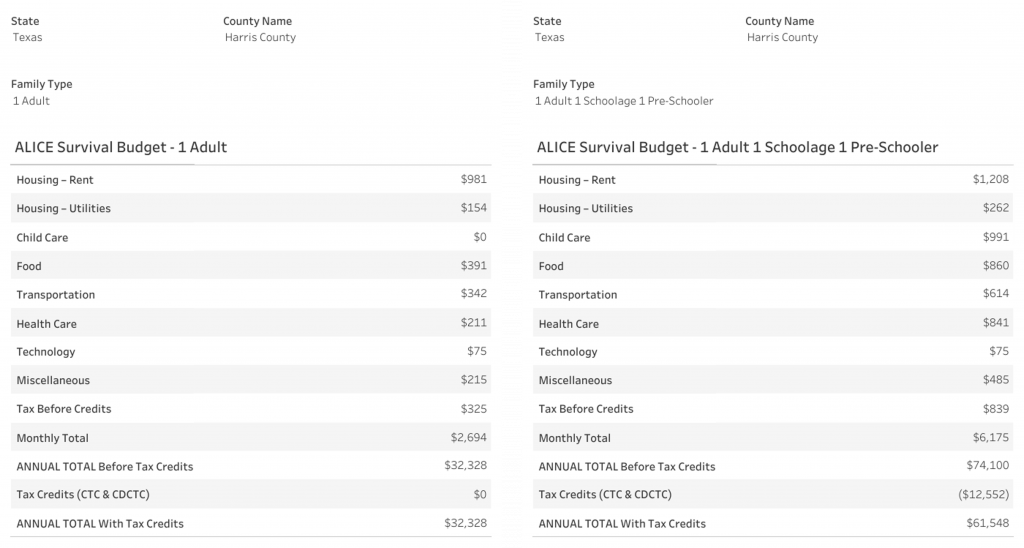
Households experiencing ALICE typically spend more than half of their income on housing and transportation, leaving less money for other essentials. The local cost of rent represents the greatest expense for a family of three in Harris County, averaging $1,208 per month. The same size family in Fort Bend would need $1,574 per month for housing and $1,334 in Montgomery County. The average monthly cost of transportation was $364 for the same size family across all three counties.
You can use the ALICE Survival Budget calculator to explore the Survival Budget for different household combinations.
Who is ALICE?
The ALICE data also reveals disparities and challenges faced by different groups of households in our community. By race and ethnicity, 43% of Black and 45% of Hispanic households were experiencing ALICE across Fort Bend, Harris, and Montgomery counties in 2021, compared to 25% of white households.
By age of head of household, those with a head of household under 25 years old or over 65 years old had the highest rates of financial hardship, with 40% and 42% experiencing ALICE respectively across the three counties.
By household composition, single-parent families with children were more likely to experience ALICE than married-parent households or single/cohabiting households without children. Single-female-headed households with children experience ALICE at 35% and single-male headed households with children experience ALICE at 45% across Fort Bend, Harris and Montgomery counties.
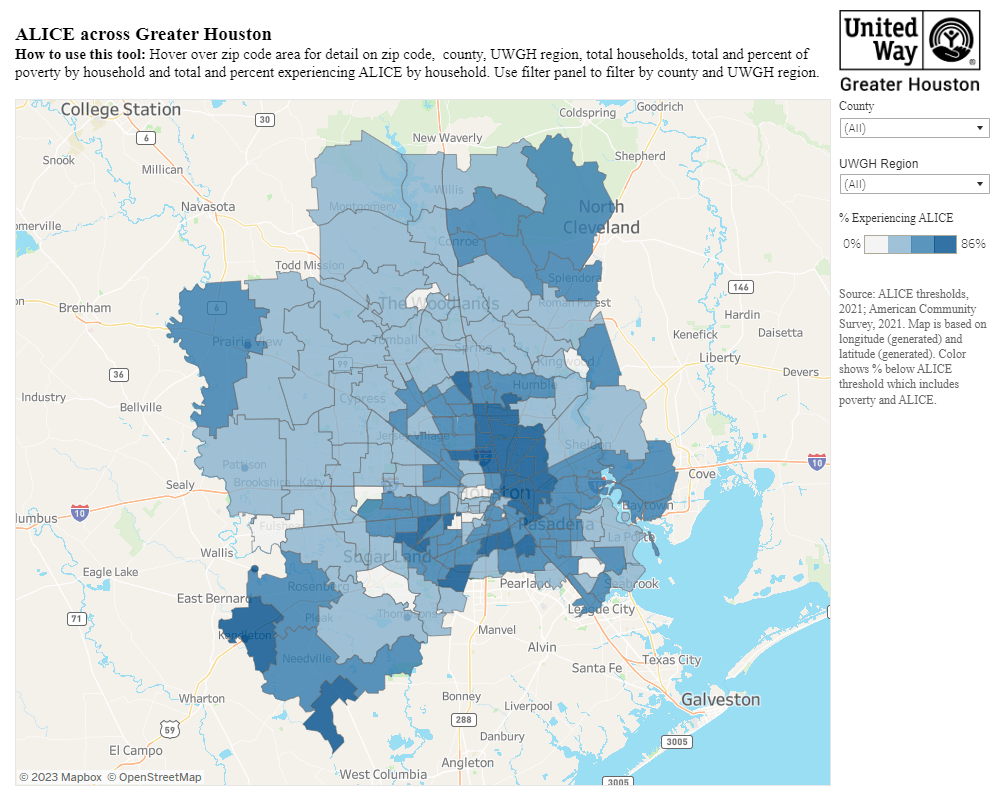
We see the number of those experiencing ALICE growing across communities. You can dive into the ZIP Code level data for prevalence of those experiencing ALICE and living below the FPL. For example, when reviewing ZIP code level data, 77417 in Fort Bend County has 6,923 households experiencing ALICE, an increase of nearly 5% since 2018. In Montgomery County, zip code 77306 has 2,139 households experiencing ALICE, up 14% from 2018.
Where we live matters, impacting your financial stability, health, life expectancy, exposure to violence, access to resources, and housing. Yet individuals and families experiencing ALICE — whether they are homeowners or renters —are frequently forced to make difficult choices or sacrifices in other areas of their lives.
What’s important about being able to look at the ALICE data from this lens is that households of all ages, genders, races, and ethnicities, living in rural, urban, and suburban areas, are impacted by financial hardship.
ALICE and COVID
What’s important about being able to look at the ALICE data from this lens is that households of all ages, genders, races, and ethnicities, living in rural, urban, and suburban areas, are impacted by financial hardship. The ALICE data shows that financial hardship is not a temporary or isolated problem, but a persistent and widespread issue that affects households across our community. It also shows that the COVID-19 pandemic exacerbated the situation for many ALICE households. They faced employment shifts, health struggles, and disruption to day-to-day life activities.
Throughout 2020 and 2021, there were various temporary pandemic supports that provided a much-needed cushion for these struggling households, such as a range of direct assistance programs, including pandemic-specific unemployment insurance, economic impact payments, expanded Child Tax Credit (CTC) and Child and Dependent Care Tax Credit (CDCTC), and emergency rental assistance. The temporary relief mitigated the pandemic’s negative financial impact on ALICE households, avoiding what could have been a deeper economic crisis overall.
When combining the households that are living below the federal poverty level and experiencing ALICE, over a million households are forced to make difficult choices and risky tradeoffs every day across our area. This requires them to make tough choices, often forgoing basic necessities such as healthy food and health care which is why sufficient incomes matter for everyone.
How to Use ALICE Data
The ALICE data also highlights the opportunities and solutions that can help households achieve financial stability and well-being. United Way of Greater Houston is using the ALICE data to guide the Integrated Client Journey, which consists of a network of over 100 funded nonprofit partners that coordinate services to support those that identify as ALICE. The vision is that these organizations work together to help individuals and families to reach financial stability, ensuring that individuals and families in our community have the opportunity to thrive and to prosper.
We invite other service providers and community stakeholders to explore and use this data to gain a deeper understanding of the realities many of our neighbors are facing and how we as a community can lift up those struggling to make ends meet. To learn more about ALICE data visit https://unitedwayhouston.org/what-we-do/employed-but-in-need/.